


Nearly 70% of users skip traditional, linear product tours. The way people evaluate software has changed; the way many tours are built has not. That mismatch shows up as slower time-to-value (TTV), lower activation, and higher early churn.
Using insights from Chameleon’s Benchmark Report 2025, public case studies, and peer-reviewed behavioral research - and co-authored with Flow (analytics and experimentation partner) - this piece explains what’s breaking in old-school tours and how modern, adaptive onboarding gets more users to their first “aha” faster.
How SaaS Onboarding Has Changed (and Why Tours Haven't)
Traditional product tours were built for patient, linear users - but today’s SaaS customers demand immediacy, autonomy, and relevance.
Old pattern | Why it fails in 2025 |
Linear 7-15-step tours | Linear 7-15-step tours → Completion rates drop sharply beyond the fifth step, especially when tours autoplay (start automatically on page-load or after a fixed delay, without any user action such as a click/hover/intent). |
Feature-first explanations | Emphasizes what the product does, not why it matters to the user’s job-to-be-done. |
One-size-fits-all flows | Ignores role, intent, JTBD, and prior behavior - so steps feel irrelevant. |
No behavioral feedback loops | The same tour shows even when a user has already explored the feature. |
As Flow's data analysis reveals, these friction points typically cause 40-60% user drop-off before reaching their first "aha!" moment.
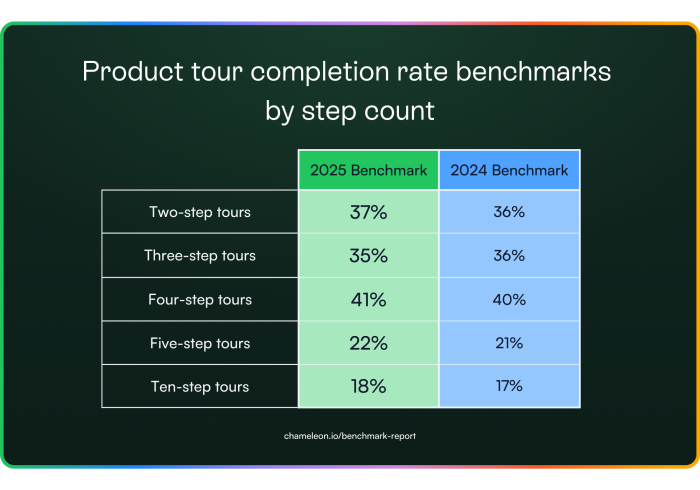
The Numbers Are Stark: Shorter Tours Mean Higher Completion
Chameleon's 2025 benchmark data reveals two striking facts:
72% completion for three-step tours
16% completion for seven-step tours
Progress indicators improve completion by ≈12%
User-triggered or smartly timed tours outperform delayed/blanket triggers by ~2-3×
The pattern is consistent in Chameleon’s benchmarks: keep tours to five steps or fewer, make start user-initiated, and use progress cues to sustain momentum.
Adding even one extra step causes completion to plummet. Brevity and relevance create momentum and user autonomy - two crucial drivers for ongoing engagement.
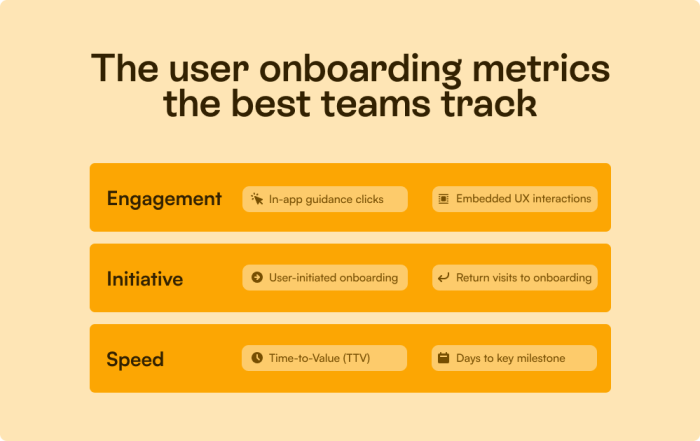
Engagement, Initiative, Speed: The New Onboarding Metrics
To measure effective onboarding, Flow's analysis framework tracks three key dimensions that align with Chameleon's data insights:
1. Engagement
In-app guidance clicks
Embedded experience interactions
In-app Microsurveys perform far better when contextual: overall completion around ~15%, but when launched via Launchers we see ~54% completion in Chameleon’s data; generic NPS has fallen into single digits.
2. Initiative
User-initiated onboarding triggers
Return visits to onboarding resources
Completion of optional setup tasks
3. Speed
Time-to-Value (TTV): Many SaaS companies aim for under 24 hours for core features
Days to complete the first key milestone (predictive of retention)
These metrics directly correlate with onboarding success and revenue retention.
Contextual Onboarding in Action: Real-World Examples
Through Flow's experimentation work, we've validated these proven tactics because they consistently outperform traditional onboarding methods. Here’s a peek into what contextual onboarding looks like when it's done right:
Tactic | Real-world Example |
Behavioral segmentation | Route by role/intent so the first tasks and examples match the user’s goals. |
Real-time UI adaptation | Show tips only after relevant actions (or hesitation) rather than immediately. |
Friction heatmaps | Surface inline help where rage-clicks or repeated errors cluster. |
Benchmark anchor (Chameleon 2025): Launcher-driven tours reach ~67% completion, users who open a Launcher complete ~5 checklist items per session, and Embeddables generate up to ~1.5× more actions than pop-ups.
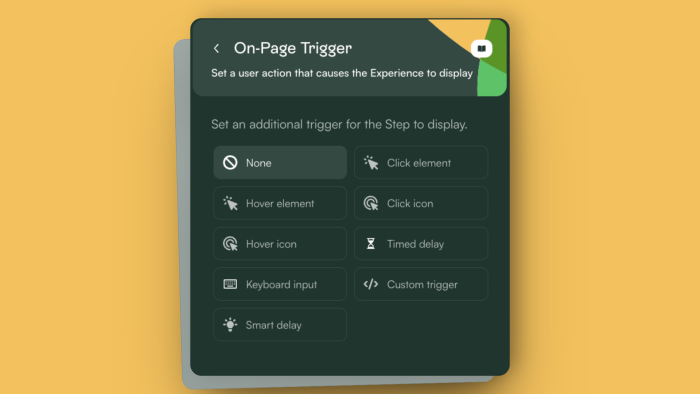
How you can trigger Chameleon Experiences at the perfect time
The Power of User Autonomy
Giving users control - letting them start help when they need it - improves trust and completion. In the benchmarks, user-triggered tours outperform delayed or blanket triggers by ~2–3×, and tours beyond five steps see sharp drop-offs. Pair autonomy with progress cues and embedded guidance to keep momentum without intrusion.
Using Behavioral Science to Boost Activation
Flow's experimentation data consistently validates behavioral psychology principles. Here are a few of our favorite principles in action:
Zeigarnik Effect: Visible progress checklists keep an “open loop,” driving double-digit gains in completion in published studies.
Endowed Progress: pre-fill the first step (“Account created ✔︎”) to increase completion significantly in lab and field experiments.
Goal Gradient Effect: users speed up as they near the finish; call out “1 step left” to harness that energy.
(See behavioral references in Sources.)
What Happens When You Get Onboarding Right?
Investing in onboarding isn't just nice-to-have - it's a proven growth strategy. A quick look at some success stories shows just how impactful it can be:
Senja: activation doubled, MRR grew from $0 → $33K.
Rocketbots: activation doubled from 15% to 30%, conversion rate increased from 3% to 5%, resulting in a 300% increase in MRR after implementing onboarding checklists and guided tooltips.
Canva: 10% activation increase through personalized onboarding experiments that segment users by role and intent.
Quick-Start Checklist: Action Steps Today
Want to make improvements right away? Here’s a simple checklist you can tackle immediately to start moving the needle:
Map your current onboarding flow - cut the extras if you have more than five steps.
Add a clear progress bar or checklist to visibly guide your users.
Make your first call-to-action user-triggered, not automatic.
Track Engagement, Initiative, and Speed metrics carefully to identify issues.
Experiment with Zeigarnik-style progress indicators for the next 14 days and measure the impact.
Conclusion: Product Tours Aren’t Dead - They've Evolved
The traditional product tour isn't obsolete, but it definitely can't stay static. Modern onboarding must deliver contextual, personalized experiences that adapt to user behaviors and preferences in real-time. Instead of counting the steps users take, successful onboarding now measures how quickly users achieve value and how responsive the product is to their individual needs.
It's not about explaining every feature - it's about getting users to their "aha!" moment faster, driving growth by helping users succeed quickly.
Onboarding isn't a phase, it's your growth engine
📚 Sources
Nunes & Drèze (2006, JCR): https://academic.oup.com/jcr/article-abstract/32/4/504/1787425
Kivetz, Urminsky & Zheng (2006, JMR): https://journals.sagepub.com/doi/abs/10.1509/jmkr.43.1.39
Fogg Behavior Model (Stanford): https://behaviordesign.stanford.edu/resources/fogg-behavior-model
Fogg (2009, ACM): https://dl.acm.org/doi/10.1145/1541948.1541999
Zeigarnik (1927) translation PDF: https://gwern.net/doc/psychology/willpower/1927-zeigarnik.pdf
Conrad et al. (2010, PMC): https://pmc.ncbi.nlm.nih.gov/articles/PMC2910434/
Pattern-specific data (from the Benchmark page): modal timing & dismissal, Launcher completion, Embeddables vs pop-ups


