


Most interactive demos fail. Here's how to make sure yours don't.


Why most demos fail to convert
- Manual A/B testing is nearly impossible, so you build one demo and cross your fingers.
- You're flying blind without knowing which demo elements actually drive results.
- Demo completions are seen as success, while actual product adoption flatlines.
See how your demo stacks up
Use the calculator to compare your demo to benchmarks, then identify the highest-impact changes to test.
Demo Characteristics
How is your demo currently structured?
Organized into sections
Multiple demo flows
Custom videos, screenshots, backgrounds, or voice-over
Pan & Zoom, animations beyond basic hotspots/callouts
Business Metrics
Enter your current business metrics
Number of new prospects who sign up for your product each month
Your average annual contract value per customer
Typical SaaS churn rates: 2-8% monthly
Benchmark Comparison
See how your predictions compare to industry benchmarks
Industry Benchmark
What's Working Well
Growth Opportunities
Predicted Business Impact
Based on your demo characteristics and business metrics
How We Calculated This
Click to see calculation methodology and data sources
Conversion Rate Calculation
Base Rate: We start with a 15% industry baseline based on SaaS demo benchmarks.
Demo Length Impact: Short demos (1-5 steps) perform 45% better than baseline, while long demos (16+ steps) perform 45% worse due to reduced engagement.
Gating Strategy: Ungated demos see 35% higher conversion, while fully gated demos drop by 42% due to friction.
Content Quality: Concise copy (under 20 words) improves conversion by 35%, while verbose content (35+ words) reduces it by 35%.
Advanced Features Impact
Intro Chapters: +40% improvement based on 72% higher play rates observed in structured demos.
Branching Paths: +25% improvement - top 10% performers use 1.4x more branching than average.
Branded Visuals: +20% improvement based on professional presentation standards.
Advanced Effects: +30% improvement - 80% of top performers use Pan & Zoom animations.
Lifetime Value (LTV) Calculation
Formula: LTV = (ACV ÷ 12 months) × (1 ÷ Monthly Churn Rate)
Example: $12,000 ACV with 5% monthly churn = ($1,000 monthly) × (20 month lifetime) = $20,000 LTV
Revenue Impact: Additional customers per month × LTV = total value of conversion improvements
Data Sources
Industry Benchmarks: Based on Arcade's Demo Benchmarks Report
Conversion Factors: Derived from A/B testing results and performance correlation studies.
SaaS Metrics: Churn rates and ACV ranges based on public SaaS benchmarking studies.
Limitations: Results are estimates based on industry averages. Actual performance may vary based on your specific product, market, and implementation quality.
Start your A/B test here:
No more than 10 steps
Don't try to cover your whole product in one demo. Short demos beat the average conversion rate by 45%.
Remove the gate
Ungated demos build awareness, attract curious users, and get 35% higher conversion.
Add chapters
No one can resist a warm welcome. Structured demos with intro chapters see 72% higher play rates.
More demo conversion tactics from our CEO:
A/B test Demos that drive real product adoption with Chameleon
.png)
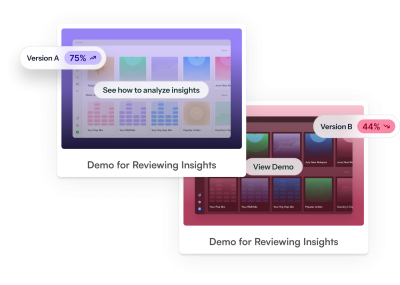
Launch tests in one click
Create a Demo variant and test anything: chapters, steps, CTAs, and more. You have full control.
.png)
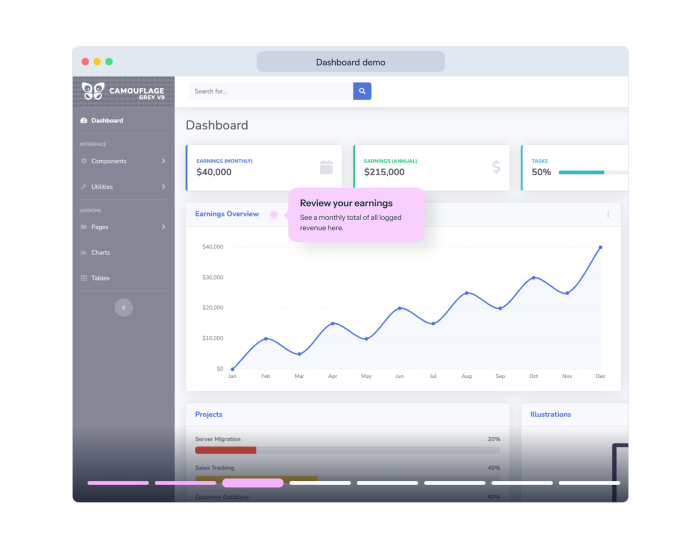
Measure impact, not impressions
Demo completions mean nothing if users don't adopt your product. Set Goals to declare winners based on real usage, not vanity metrics.
.png)
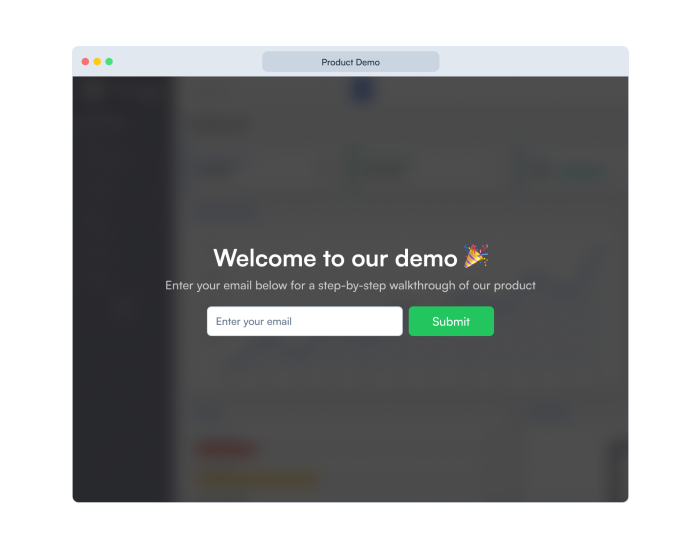
Track results automatically
Split traffic however you want and watch the results roll in. Compare analytics side-by-side to determine the winner at a glance.
.png)
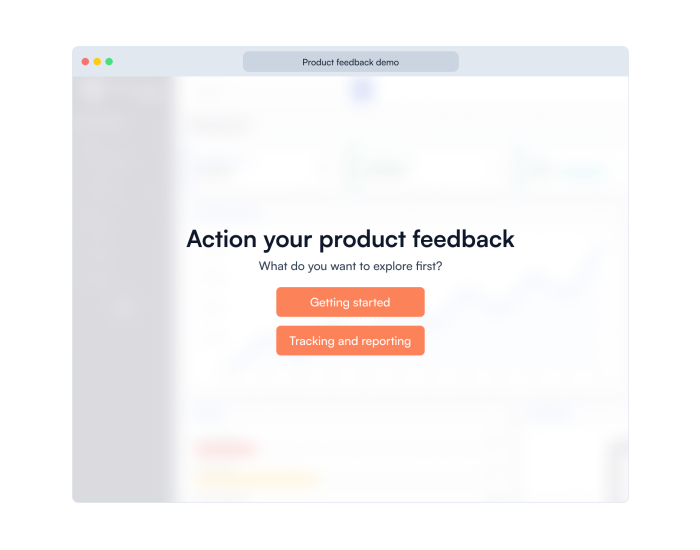
Rinse and repeat
Each test reveals what drives adoption. Apply learnings to raise the bar on every future Demo.
See Demos A/B testing (and best practices) in action
Start A/B testing Interactive Demos that drive adoption
Book a demo to get your free trial with A/B testing ready to go.
“The Sales process was casual and I didn't feel any pressure to buy the entire time.”


Get your personalized demo today