


When you visit a car dealership, you get two options—talk to a salesperson or test drive a car yourself. In the world of SaaS, the latter is product-led growth. Users try your product for a while and if all goes well, they become paying customers. Sounds simple, right?
Here’s the catch: with low-to-no sales staff to connect with your users and understand their expectations, there’s little scope for identifying their challenges in the trial period and optimizing their experience so they’re ready to buy.
This is where product-led growth metrics can change the game for you.
PLG metrics allow you to track progress against your growth targets and switch gears whenever necessary. In this article, we'll break down the 11 essential product-led growth KPIs to help you make informed decisions for sustainable growth.
Product-led growth companies succeed with cross-functional teams, using a common language of PLG metrics
PLG metrics are crucial for understanding different aspects of your growth—user engagement, customer satisfaction, net revenue retention, and more
Deciding the right PLG metrics for your team depends on your business model, growth stage, and customer lifecycle
What do experts say? Tips from ProductLed, Hightouch, and Heap
We reached out to experts from ProductLed, Hightouch, and Heap with a few questions to get their insights:
What are the key metrics every PLG-oriented team should track?
How should teams identify the specific metrics that are the best fit for them?
What is the best way to uncover insights from product analytics and apply them to drive PLG?
What are the best ways to integrate data from various sources and implement insights?
Let’s take a look at their answers and advice.
ProductLed: Use the same success metrics for all teams
Wes Bush, CEO and Founder of ProductLed, emphasizes the importance of these PLG metrics:
Acquisition: The number of users who have signed up for your free experience.
Activation Rate: When the user has experienced meaningful value in the product. (Sometimes referred to as the “Aha!" moment).
Customer Lifetime Value (CLV): A prediction of how much revenue a single customer will bring in for your business during your relationship.
Time-to-Value (TTV): The time it takes new users to reach their activation moment. The faster you get users to activate, the more likely it’ll be that they stick around. The main goal of a good onboarding experience is to reduce TTV by as much as possible.
Free-to-Paid Conversion Rate: The percentage of users that have converted to a paid account from a trial period.
Expansion Revenue: Expansion revenue is the anti-churn, and one of the most important levers for SaaS growth. Expansion revenue measures the revenue generated from existing customers through upsells, add-ons, cross-sells, etc.
Net Revenue Churn: This metric measures the amount of money lost after accounting for new and expansion revenue and is often expressed as a percentage.
Average Revenue Per User (ARPU): This is a great indicator of the overall health of your business. You can calculate this by dividing the Monthly Recurring Revenue by the number of customers.
As Wes says, all of the metrics above are important to track, but one thing that separates the product-led approach is the cross-team collaboration on product data.

One of the key differences between product-led growth and sales-led growth is the way all teams leverage the product to meet their goals. Instead of each team tracking different success metrics, in a product-led growth model, Marketing, Sales, Customer Success, and Product Management teams all track the same success metrics.
Hightouch: Put data into motion across your org
“Everyone wants to do PLG but actually operationalizing it is hard”, notes Alexis Jones, Product Marketing specialist at Hightouch.
And here’s the common construct that Brian Kotlyar, VP of Growth and Marketing at Hightouch, recommends to ensure teams are consistently improving their trajectory and likelihood to succeed.

In terms of the high-level PLG funnel, think about the following questions as they relate to your specific business situation, and then prioritize securing those metrics and putting (ideally automated) workflows in place to support them.
Brian recommends tracking these metrics, while also noting which of the teams should lead the monitoring for each:
Site visits (Marketing team): Where are people coming from? How do we optimize traffic in high-converting sources? How do we improve conversion rates from low-converting sources? How do we divert people who we don’t believe are PLG-ready to sales-led conversion paths?
Sign-Ups (Marketing team): How many people are signing up? From which traffic sources? Which campaigns? (Look at first/last/any attribution to understand this.) What are the intent levels of these signups (are they just filling in the first form, or actually making it deep into the sign-up flow, and even past it into the app)? What specific webpage are people signing up from? Where aren’t people signing up (docs and blogs are common sources of interest)?
Activations (Marketing team & Onboarding team): What is our activation metric? What self-serve onboarding experience are we offering? How do we nudge abandoned signups?
Engagement and deepening product usage (Onboarding team & Product team): How are growth/engagement concepts playing out across the app? Do we nudge inside and/or outside the app to take the ‘next best action’? Do we even know what that is? Is the website experience the same for these people as for others?
Exceeders (Product team & Monetization team): How are we introducing monetization (freemium? trial conclusion?)? What nudges and gates do we want to put in place (paywalls, lockouts, etc.)?
Post-Payment (Monetization team): How will we define and communicate value? What expansion paths should be recommended based on usage patterns?
Across this entire PLG funnel, teams should also think through their strategy for when Sales should intervene (this is known as the PQL or Product Qualified Lead strategy).
And what are the best ways to integrate data from various sources and implement insights?
Once you’ve targeted the appropriate PLG metrics for your business, Alexis Jones suggests it’s time to put that data into motion across your org: “If you’re using a cloud data warehouse as your organizational source of truth (and we think you should be!), then it’s really easy to activate that data in a consistent manner to virtually any downstream app and team”.

By syncing data from your warehouse into operational tools using Hightouch, you could, for example, deliver in-app notifications to users that are in overage, encouraging them to upgrade their account, alert sales teams of the real-time customer engagement so they can customize their outreach, run marketing experiments to deliver A/B tests on messaging and content based on randomly generated customer cohorts, and much, much more!
Hightouch wrote a blog post about how they’re using Hightouch to power their own PLG engine – check it out.
Heap: Monitor user behavior across the funnel
When it comes to key metrics every PLG team should track, Connie Yuan, Senior Product Manager within the Growth team at Heap, suggests keeping an eye on key steps throughout the funnel.

Assuming PLG here is defined as using the product (trial experience or freemium experience) to acquire new customers, I would say it’s extremely important to keep a pulse on a few key steps across the full marketing and product funnel.
Here are the questions that Connie suggests considering at each stage of the funnel:
Starting at the top of the funnel, how are sign-ups looking by channel? How do they compare to the previous month, quarter, or year?
Moving down the funnel, how well are sign-ups activating (i.e. how many people who signed up in the past week reached some “value-driving activity” within X days) and how does that compare to industry benchmarks?
Moving further down the funnel, how well are trialers or free users converting? Does this differ by geography, company size, or other types of segmentation?
And when it comes to the ways you can uncover insights from product analytics and apply them to drive PLG, Connie explains that teams focusing on PLG care a lot about discovering leverage – in other words, what can we build or change to have an outsized impact on revenue through our key metrics?

Product analytics is so important to PLG teams because we often don’t have a personal relationship with our end users. I can’t go bug a Customer Success Manager to let me interview their customer.
Connie continues to explain that, at Heap, they found the best way to uncover insights is to use a blend of qualitative and quantitative data to learn about their users.
For qualitative data, as she notes, they use Session Replay and survey data (e.g. NPS, in-app surveys) to generate experiment hypotheses, see what happened during an experiment, and fix user experience friction that is hard to see in the quantitative data. They use quantitative data to keep a pulse on key funnels over time and look at experiment outcomes.
We often use qualitative methods to dig deeper into weird things we noticed in the quantitative data – e.g. funnel is looking soft this month compared to last month, so we watch some session replays around key funnel steps this month to diagnose why. Similarly, we use quantitative data to drive prioritization around unexpected behaviors we’ve noticed in the qualitative data – e.g. we noticed some users get stuck on an in-app prompt and want to know how many users experience this confusion to prioritize a fix.
Deep dive: 11 key product-led growth metrics to track
Put simply, product-led growth metrics hit three targets with one arrow:
Measure product led customer success of your strategy
Map your performance against your overall goals
Identify any red flags potentially hampering your growth
Now that we’ve gathered expert insights, let’s take a deep dive into the 11 must-have PLG metrics to make your strategy airtight and boost your bottom line. Ready?
1. Product stickiness
Remember your favorite restaurant that you keep going back to because the food is just so good? That’s stickiness in simple words.
Stickiness measures how many users find enough value in your app to return for regular use. Your stickiness ratio indicates the number of users who have grown habitual to your app and use it within routine workflows. A higher stickiness ratio means users frequently use your app in their processes—great!
Measuring product stickiness is essential for:
Visualizing your product usage value
Understanding what makes users stick to your app
Mapping the differences in product usage among different user personas
Here’s how you can calculate product stickiness.

2. Churn rate
The churn rate calculates the number of users leaving your product, never to return. Users churn when they're unhappy with your product, don't find any more value, or discover a better solution than yours.. ouch.
Calculating the churn rate will indicate users' satisfaction with your product and show how well you deliver value—or not!
Staying on top of your churn will help you:
Take proactive steps to fight it
Identify drop-off points to optimize the product experience
Collect user feedback to identify necessary product changes for different personas
Here's how you can calculate the churn rate.

3. Time to Value
When you drive a new car, you’ll inevitably spend some time adjusting yourself to the steering, gears, and its many features, until you get into the optimum position. That’s what time to value measures—the time it takes new users to gain value from your product and reach their ”aha!” moment.
Often referred to as TTV, it’s one of the most crucial metrics to measure product-led growth. If users take a long time to experience your product's benefits, most of them will churn before reaching activation—which means you’re missing your retention goals.
Calculating time to value allows you to:
Enhance and simplify your onboarding experience
Identify areas of friction in the initial customer journey
Create proactive support resources to guide new users
Here’s how you can calculate time to value.

4. Product adoption rate
The product adoption rate is one of the most significant performance indicators for the PLG growth model. It measures the percentage of users who have fully embraced your product to become regular users—the kind who’ve become habitual in using your SaaS and don’t want to switch to other options.
This metric studies user behavior to calculate the number of free or freemium users turning into paying customers every month.
Measuring your product adoption rate helps in:
Maximizing customer delight and retention rate
Building necessary customer education resources
Changing your product roadmap as per user feedback
Here's how you can calculate the product adoption rate.

5. Retention rate
The customer retention rate calculates the percentage of users who continue to use your product in a given timeline—as a measure of customer loyalty.
The opposite of the churn rate, your retention rate indicates how happy your customers are with your product to stick to it month after month. Retention is among the most critical SaaS metrics for PLG metrics because it indicates that users genuinely find value in your product to stick to it in the long haul.
Calculating your retention rate allows you to:
Identify what’s retaining users and double down on it
Invest more resources in retention over acquisition to stabilize this rate and grow more sustainably
Understand how well your product delivers value to solve users’ pain points over time
Here's how you can calculate the retention rate.

6. Expansion revenue
Expansion revenue is the revenue you earn from your existing customers beyond their regular payments.
This additional revenue, whether it’s MRR (monthly recurring revenue) or ARR (annually recurring revenue) comes from upgrades or extra services/products, indicating how invested users are in your product to upgrade their plans for accessing more features.
It shows your users trust you enough to go beyond their usual payments and get upgrades.
Tracking expansion MRR helps you:
Understand user sentiment for your product’s value and your brand
Actively boost your bottom line by increasing expansion revenue
Measure the impact of your upselling and cross-selling efforts
Here’s how you can calculate expansion revenue.

7. Net Promoter Score
Net Promoter Score (NPS) measures your customers’ satisfaction and loyalty in the most candid way possible. An NPS survey asks questions to analyze a user’s relationship with your brand—whether they’re happy, enthusiastic, passive, or unlikely to recommend your product to someone else.
Measuring your net promoter score helps in:
Realistically understanding your customer-brand relationships
Identifying users who can potentially become product champions
Identifying those users likely to churn and get to work on keeping them
Creating internal benchmarks to improve customer success teams’ performance
Here’s how you can calculate Net Promoter Score.

8. Trial conversion rate
While many interested buyers would like to test drive a car, not everyone would end up buying it. The trial conversion rate tells you if your car is a hit or a miss among your buyers.
This metric calculates the number of free users becoming paying customers during the free trial period. It calculates how many users found enough value in your product to switch from a free or freemium plan to a paid one.
Calculating the trial conversion rate indicates:
Your time-to-value rate for free users
The effectiveness of your immediate user experience and onboarding flow
How well users can understand your product
Where new users place value
Here's how you can calculate the trial conversion rate.

9. Feature adoption rate
Feature adoption rate specifically analyzes every product feature’s value for your users. Like product adoption, this metric reviews every feature individually to understand what’s boosting product stickiness and user engagement. It’s an important part of the product usage data stack, depicting your SaaS’s overall value.
Measuring feature adoption rate is vital for:
Identifying the most-used and least-used product features
Re-shaping your product positioning based on the most popular features
Identify gaps in the market for new feature development going on feedback
Scoping the potential to improve high-value features for increasing adoption
Here's how you can calculate the feature adoption rate.

10. Product-Qualified Leads
Product-qualified leads will likely buy/subscribe to your product because they've performed a key task and experienced their "aha!" moment to realize your product's value. With PQLs, you can rely on product usage signals to assess the chance of conversion and let your inside sales team focus on high-value leads.
Tracking product-qualified leads can help you:
Measure the effectiveness of your product-led growth strategy
Understand what actions or features nudge users toward activation
Align your marketing, product, customer success, and engineering teams for different stages of the customer lifecycle
Tracking product-qualified leads is tricky, as each SaaS has its own version of what a PQL looks like. You’ll need to identify what this lead looks like: demographics, actions taken, source, etc, and give a point system to each action or factor that you think weighs them toward product qualification. Once any prospect reaches a certain amount of points, they should be ready for your product.
Wondering how to put the PQL strategy into practice? Read more about the actionable steps you can take to achieve your growth goals with PQL scoring tactics and playbooks to drive more product-led revenue.
11. Customer Lifetime Value
Customer lifetime value (LTV) calculates the revenue you can expect from a single customer during their journey with your brand. Instead of measuring how long a customer will stick to you, it monetizes that timeline to tell you how much they are (financially) worth to you.
This metric can be a game-changer for your customer service team, helping them separate the high-paying and more invested customers from the low-potential ones.
Measuring customer LTV helps in:
Balancing your customer acquisition cost according to the average CLV
Monitoring your growth consistently and optimizing for better performance
Analyzing the ROI of your marketing efforts and prioritizing which channels or strategies bring the highest ROI
Here’s how you can calculate customer lifetime value.

How to know which of the PLG metrics is right for you
The success of a product-led growth company depends on its cross-functional teams. With the right PLG metrics, you can build stronger alignment between multiple teams and make informed decisions about your growth targets, current performance, and everything in between.
But, how do you decide which PLG metrics are right for your business model and product type? There’s no one-size-fits-all set of metrics for all SaaS companies. However, you can decide your product-led growth metrics depending on how you monitor user behavior and the customer lifecycle.
One of the most commonly accepted product analytics frameworks is the Pirate Metrics framework, also known as the AARRR approach.
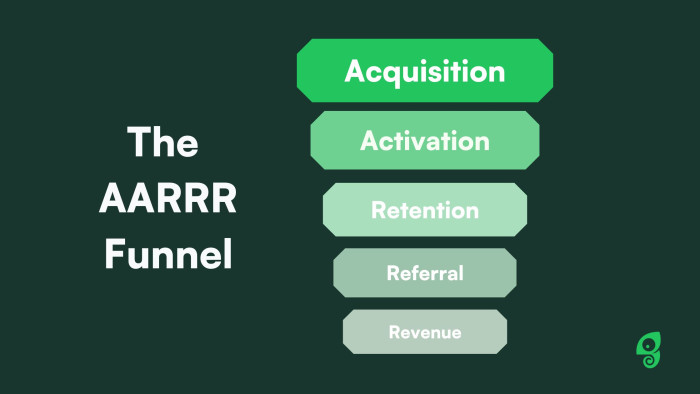
This framework divides the user journey into five main stages:
Acquisition: When a user signs up for your product
Activation: When a user completes one or more activation milestones
Revenue: When a user becomes a paying customer
Retention: When a user realizes the product value to become a regular user
Referral: When a user refers your product to other potential users
It is a traditional technique for measuring the health of your PLG strategy and forecasting your business growth, and it's better suited for the initial stages of PLG companies when growth is slow.
On the other hand, if you’re experiencing rapid growth and you’re looking for a framework that’s more applicable to your needs, you can use the RARRA framework.
Think of it as the AARRR funnel flipped on its head, starting with retention. After all, retention has become the #1 lever for growth, and it’s one of the most relevant product trends in 2023.

Fuel your product-led growth with the right metrics
Product-led growth can promise great ROI, but not without strong customer data to guide the way forward. You need to consistently track your PLG metrics to objectively assess your performance and ensure you’re on the right track with your PLG strategy.
Use the pro tips and advice from this article to understand how your users are faring in the trial period and what you can do to optimize their experience. Keep an eye on free-to-paid conversions and improve your product for seamless growth.

Boost Product-Led Growth 🚀
Convert users with targeted experiences, built without engineering


