








You shipped a feature your power users love. They're deep in the docs, filing detailed bug reports, and building integrations no one on the product team anticipated. Meanwhile, most of your user base hasn't touched it.
That gap is predictable. It has a name: the adoption curve. Those five segments differ in more than timing. They churn for different reasons, respond to different channels, and need completely different onboarding approaches. The playbook that activates an innovator will frustrate a late majority user. What follows maps each segment to the behavioral metrics that identify it and the experience types that actually move users forward.
TL;DR
-
The adoption curve maps how a population adopts a product across five segments (innovators to laggards), first described by Everett Rogers in 1962 and extended by Geoffrey Moore in Crossing the Chasm (1991).
-
Each segment has specific behavioral metric signals that identify it accurately, without relying on demographic proxies like job title or signup date.
-
The chasm between early adopters and the early majority is where most SaaS products stall. Crossing it requires peer social proof, not just better onboarding.
-
The right in-app experience differs by segment: triggered tours for early adopters, self-serve launchers for early majority, and ambient embeddables for late majority.
What is the product adoption curve?
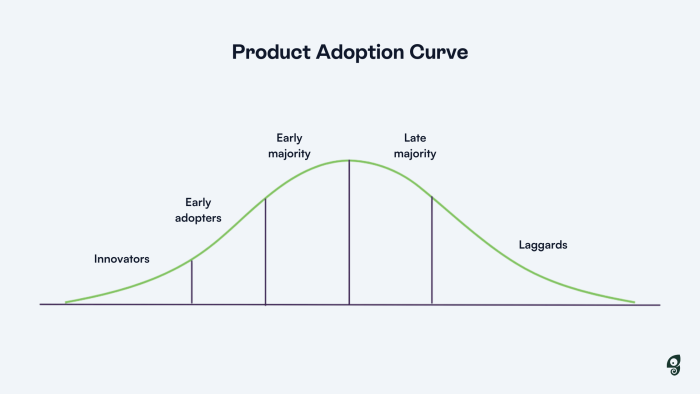
The adoption curve is the cumulative rate at which a population adopts a product or technology over time, visualized as a bell curve across five segments: innovators, early adopters, early majority, late majority, and laggards. Everett Rogers first described it in his 1962 book Diffusion of Innovations.
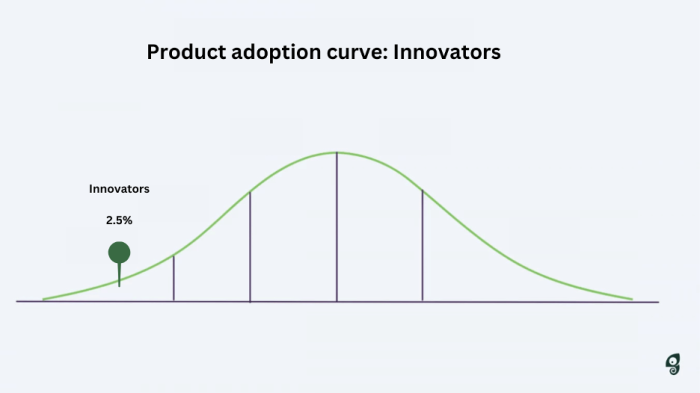
Rogers assigned specific proportions to each segment: innovators (2.5%), early adopters (13.5%), early majority (34%), late majority (34%), and laggards (16%). Those percentages matter for product strategy because winning your first 2.5% of users requires a completely different approach than winning the next 34%.
The bell curve and the adoption curve look like the same diagram. They're not. The bell curve shows segment distribution at a point in time. The adoption curve is a cumulative S-curve that rises as each segment joins sequentially. Geoffrey Moore identified the most consequential gap in that sequence. In Crossing the Chasm (1991), he described the divide between early adopters and the early majority as the most common stall point for SaaS products before they reach mainstream scale. That gap has a name: the chasm.
What is the adoption curve in marketing?
The adoption curve is a GTM timing signal as much as a user psychology model. It tells marketers when and how to shift demand-generation channels and messaging tone as the addressable audience transitions from innovators through mainstream segments.
The channel mix changes meaningfully at each stage:
- Innovators: developer communities, API-first trials, early-access waitlists, and sandbox environments. This segment isn't browsing ad-supported channels for new tools. They're reading technical blogs, GitHub repos, and Hacker News threads.
- Early adopters: word-of-mouth programs and community seeding. Peer referrals carry more weight than brand messaging for this segment, so the acquisition lever is turning activated early adopters into advocates.
- Early majority: broad social proof campaigns and ROI-led messaging. Case studies, customer logos, and review platform ratings are the credibility signals that unlock this group. They won't buy without established proof from peers they recognize.
- Late majority: price-led campaigns and risk-reduction framing. Switching cost anxiety is the primary objection, so messaging should minimize perceived risk and make the transition look as low-friction as possible.
The timing implication matters as much as the channel mix. The curve signals when to expand to the next segment's channels, not just how to speak to the segment already converting. Moving to early majority channels before you have the social proof to back them up wastes budget and muddies positioning.
Messaging tone shifts alongside the channel mix. Innovators respond to technical depth and product novelty. Late majority users need reassurance language that treats switching risk as the primary concern, not the value proposition.
Understand the 5 product adoption curve stages
The five segments don't distribute symmetrically in terms of revenue or strategic importance. Innovators and laggards sit at either end of the bell curve (roughly 2.5% and 16% respectively), but the 34% early majority represents the first real revenue inflection point. The additional 34% of late majority users determines whether you build a durable business or a product that peaked too early.
Rogers identified five factors that govern how quickly a product moves through adoption stages: relative advantage over existing solutions, compatibility with current workflows, complexity of the adoption process, trialability (whether users can test before committing), and observability (whether others can see peers benefiting). These factors don't apply uniformly across segments. Innovators adopt despite high complexity with no observability signal required. Laggards need maximum trialability and explicit social proof before they'll act.
The chasm between early adopters and the early majority is the single highest-risk transition. Products that stall here rarely recover without deliberate segmentation strategy, because the early majority won't take cues from early adopters. They watch what other pragmatic early majority users do. The selling motion, the messaging, and the onboarding experience all have to change at that boundary.
One useful question to carry through the stage sections below: how do you actually know which stage your current user cohort is in? The per-stage metric signals covered later in this article answer that directly.
How to calculate your product adoption rate
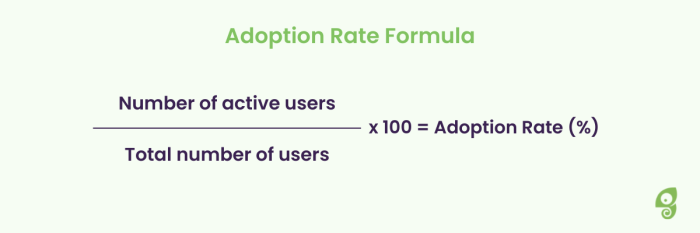
The formula is:
(new active users ÷ total new signups) × 100 within a defined time window.
The denominator choice matters more than the formula. "New signups" tracks conversion from acquisition to activation: how many people who signed up actually did something meaningful. That's a product metric. "Total addressable market" is a market share metric. It measures how far you've penetrated the potential buyer pool. These answer completely different questions, and swapping between them without flagging the change will quietly distort your trend data. Pick one denominator per question you're actually trying to answer.
The activation threshold also needs to match the adoption stage. One universal threshold hides stage-level performance. An innovator who hits the API directly on day one has a different activation event than an early majority user who completes their first core workflow in session three. Running one number across both masks that gap. A product can show strong overall activation while a specific segment (late majority users acquired through paid campaigns, for instance) is activating at half the rate. Stage-specific thresholds turn the metric into something you can actually act on: API call for innovators, core workflow completion for early majority, feature activation depth by day 30 for late majority.
What 'good' looks like at the activation threshold: according to the 2025 Chameleon Benchmark Report, contextual onboarding touchpoints correlate with 30% higher activation rates across SaaS products (all benchmark figures cited in this article are drawn from the same report). That's the benchmark to measure against when deciding whether a segment's activation rate reflects an experience gap rather than a funnel or acquisition problem.
A declining adoption rate cohort-over-cohort is usually a stage transition failure rather than a conversion funnel problem. The fix is segmentation and experience redesign.
Stage 1: Innovators
The defining signal of an innovator isn't demographic. It's behavioral. They self-activate, seek technical documentation without prompting, and generate their own use cases from whatever's available in the product or API. If you need to tell them where to go, they're probably not innovators.
That behavioral pattern has a direct onboarding implication. An innovator who opens a new product and immediately gets a five-step guided tour reads that as a signal the product isn't ready for technical users. Low onboarding intervention is the right posture. Unsolicited guidance creates friction with this segment.
The acquisition playbook runs through developer communities, early-access programs, sandbox environments, and API-first trials. Paid acquisition at scale doesn't reach this segment. They're reading technical blogs and GitHub discussions.
Where innovators add value isn't primarily as a revenue segment. They're signal and social proof sources. They'll stress-test your product in ways QA can't predict, surface edge cases before the early majority encounters them, and give you the raw feedback that shapes the product before it needs to be polished for pragmatic buyers. Being first is often a stronger motivational driver for them than having a specific job-to-be-done.
The metric that confirms innovator traction: direct API or advanced-feature activation without in-app prompting within session one. If you're tracking in-product exploration depth, innovators will surface themselves.
Rogers' relative advantage factor applies directly here: innovators adopt when the technical opportunity is self-evident from exploration. The advantage has to be visible without explanation.
Stage 2: Early adopters
Early adopters are distinct from innovators in one critical way: they're not exploring for its own sake. They have a genuine problem and they need the solution your product promises to deliver. The aha moment is non-negotiable for this segment. If they don't reach it quickly, they leave and tell people why.
That urgency shapes the GTM approach at this stage. Word-of-mouth and community-building are the primary acquisition levers, not paid reach. Every early adopter who reaches their aha moment becomes the testimonial, the case study, and the social proof that makes crossing the chasm possible. Every one who leaves before getting there is a missing link in the chain to mainstream adoption.
The onboarding design follows from the same logic. Triggered walkthroughs that surface the core value proposition within the first session do the work here, before the user self-navigates away from the activation path. Chameleon Tours are built for exactly this: multi-step in-app sequences timed to the user's first meaningful engagement, guiding them to the moment that makes the product click. For a deeper look at designing these touchpoints, in-app tutorials for product adoption covers the delivery mechanics in detail.
The benchmark data puts numbers to why this matters. 31% of SaaS companies now offer pre-signup interactive demos, up from 17% in 2023, with trial conversions 65% higher among those that do. Time-to-value instrumentation at this stage is what determines whether you build an early adopter base with enough social proof to cross the chasm.
A common mistake at this stage is treating early adopters as a beta QA cohort rather than paying customers evaluating your vision. Messaging that treats the product as a work-in-progress won't win them. Messaging that confirms the vision they're already bought into will.
Compatibility, in Rogers' terms, is the relevant factor: early adopters adopt when the product fits a problem they've already defined and been frustrated by.
Stage 3: Early majority
Pragmatic buyers don't adopt on vision. They adopt after social proof from people who look like them has accumulated. Where early adopters take cues from innovators and each other, the early majority watches other early majority users. Early adopter endorsements don't transfer across the chasm.
That distinction has a direct GTM implication. Case studies from risk-tolerant visionary buyers don't reassure pragmatic buyers. You need early majority references to win early majority customers at scale. Crossing the chasm is the prerequisite, not the reward.
At 34% of the addressable market, reaching this segment is when unit economics stabilize. CAC-to-LTV ratios normalize, referrals become a meaningful acquisition source, and the product stops feeling like it's growing through manual effort. This is product-market fit in operational terms: the jobs-to-be-done are documented, repeatable, and addressable without customization.
The onboarding experience has to change at this boundary. Pragmatic users resist interruption (and that word is doing real work here). The guided tour that confirms an early adopter's vision reads as noise to someone who opened the product to complete a specific task. Self-serve onboarding checklists via Launchers outperform triggered tours for this segment because they put users in control of their own activation pace. Open the checklist when you're ready. Complete it in sections. Come back to it. Launcher-driven onboarding achieves a 67% completion rate, the highest of any delivery mechanism, and users are 1.5x more likely to act on embedded in-app experiences than pop-up modals. For the UX patterns behind this, onboarding UX patterns backed by data is worth reading alongside this.
For an early majority user, an unsolicited guided tour signals the product is hard to use. A checklist they can open, complete in sections, and return to signals they're in control of their own activation.
Trialability matters here: this segment needs to complete meaningful work before committing, and self-serve checklists let them do exactly that at their own pace.
Stage 4: Late majority
Late majority users adopt because not adopting has become costly or conspicuous. The competitor switched. The org mandated the tool. The alternatives dried up. Product discovery almost never drives this. Social pressure does.
That origin matters for churn risk. Late majority users who fail to fully activate are the primary source of involuntary churn because adoption was pressure-driven rather than intent-driven. They don't cancel explicitly. They stop logging in and churn silently before renewal, often without a cancellation conversation.
The experience type that works for early adopters actively works against late majority users. Interruptive guided tours signal product complexity to a segment already skeptical about the switch. What works instead: ambient, low-friction guidance that appears natively within the product interface rather than overlaid on top of it. Embeddable contextual cards that surface help inline with the user's current task respect this segment's resistance to change without abandoning them at activation.
Rogers' complexity factor is the relevant one here: late majority users interpret unsolicited UI overlays as a signal of product difficulty, so the complexity factor works directly against interruptive guidance.
Users are 1.5x more likely to act on embedded in-app experiences than pop-up modals, which tracks directly with what the late majority's onboarding psychology predicts.
The retention metric to watch for this segment: feature activation depth within 30 days. Miss that threshold and a late majority user is already on a churn trajectory before the renewal conversation starts. CS teams that monitor this have an intervention window the others don't. At day 28, a rep can reach out to accounts below activation depth threshold and surface the two or three workflows that typically tip this segment into regular use. That's a very different conversation than a renewal call with an account that hasn't logged in for a month. Audience exclusion rules are also worth setting up: suppress this segment from aggressive adoption nudge campaigns, because this cohort is already skeptical and additional pressure typically accelerates churn.
Stage 5: Laggards
Laggards adopt because the alternative is no longer viable. The old tool was discontinued, the workflow broke, the org mandated the switch. Necessity is the driver. That makes this segment fundamentally different from every other group on the curve: the product team's goal at this stage shifts to migration sequencing rather than acquisition.
The product implication is practical. Laggards on legacy feature versions create disproportionate support burden and technical debt. What's the minimum viable path from where they are to where they need to be, with the least friction possible?
The migration playbook is different here. Laggards already know what the product does, so leading with product capability claims lands flat. Social proof from comparable accounts is what actually moves them: show them that organizations like theirs have already made the switch and the psychological friction drops. Forced deprecation and mandatory upgrades both skip the why. Gradual sunset timelines with clear rationale give this segment time to process the change on their own terms. Laggards need to understand why the change is happening. The how-to-click-through-it part usually figures itself out. For teams managing version transitions, migrating users through product changes and redesigns covers this in depth.
One important distinction: not all laggards represent equal investment. Some are high-tenure accounts waiting for specific feature parity before migrating, a legitimate delay rather than disengagement. Others have already decided to churn but haven't actioned it yet. Segmenting by tenure, contract value, and migration readiness before deciding on intervention depth prevents spending support resources on accounts that have already made their decision.
What to avoid entirely with this segment: in-app guided tours and activation nudges. Push-based guidance accelerates disengagement for users who have already decided against change.
Observability works in reverse here: laggards often won't move until it's visible that the rest of the market already has.
How to tell which adoption stage your users are in
Demographics won't tell you which adoption stage a user is in. Company size, job title, and signup date are weak proxies that produce consistently wrong segment assignments. A senior PM at a 500-person company can be an innovator or a laggard depending on their relationship with the specific product. Behavioral signals are the accurate classifier.
Each Rogers segment maps to a specific set of SaaS metric signals:
- Innovators: direct API or advanced-feature activation without in-app prompting within session one. If you're seeing this pattern, you have innovators. If you need to prompt them to explore advanced functionality, you don't.
- Early adopters: NPS score and feature depth expansion within the first 14 days. Fast, broad feature exploration combined with high satisfaction is the early adopter behavioral signature.
- Early majority: second-session return rate and self-serve help-doc consumption. Pragmatic users come back to accomplish specific tasks and prefer to help themselves rather than file support tickets.
- Late majority: support ticket frequency and feature activation depth at day 30. Low activation depth at that milestone is the churn predictor, not the churn event itself.
- Laggards: inactivity duration and last-login recency relative to contract age. A long-tenure account with recent login gaps is exhibiting laggard behavior regardless of plan tier.
Behavioral proxies have one gap: they can't surface intent. A user who looks like an early adopter in clickstream data might be evaluating alternatives at day 60. Someone who stopped logging in might be blocked on a specific feature rather than disengaged permanently.
In-app microsurveys close that gap. A user who reports "evaluating alternatives" at day 60 is showing late majority or laggard behavior regardless of what their feature usage data says. In-app microsurveys achieve approximately 25x higher completion rates than email surveys, around 15% versus less than 1%, which makes them the most reliable tool for surfacing intent signals that clickstream data can't infer.
The practical segmentation rule a non-technical PM can act on: combine recency (last login), depth (features activated), and frequency (session count) into a behavioral audience filter. That combination gives you a working stage classifier without requiring event tracking schemas, and it stays accurate as user behavior evolves.
One thing not to conflate: adoption stage and customer health score. They overlap, but a high health score can mask laggard behavior on a specific feature or workflow. Stage identification works at the feature level, not just the account level.
A segment-by-segment in-app experience playbook
The most common adoption curve mistake is a single onboarding flow trying to serve all five adopter segments at once. The experience type that activates an early adopter will frustrate a late majority user. The guided tour that confirms an early adopter's vision is noise to an early majority pragmatist who wants to complete a task without being interrupted.
Here's how the mapping works:
Innovators: minimal guidance. Surface API docs and sandbox access. A feature announcement that links to relevant documentation gets you further than any structured walkthrough. If they want a tour, they'll find it. A full onboarding sequence signals product immaturity to the segment that will stress-test it hardest.
Early adopters: triggered multi-step tours that confirm the value vision within the first session. This segment wants a directed path to their aha moment. The experience should follow the activation sequence and stop once core value has been delivered, without extending into edge cases or secondary features.
Early majority: self-serve launcher checklists they control. This is the contrast that matters most. An early majority user who gets a triggered tour feels managed. The same user with a checklist they can open, complete in sections, and return to feels in control of their own activation.
The reverse is also true, and the behavioral logic is worth making explicit: a launcher checklist fails early adopters not because they resist the effort of self-direction, but because they've already committed to a vision and want the product to confirm it. They need a directed path to the aha moment — the checklist signals optionality where they're expecting direction. The experience that activates one segment is the wrong signal for the other. Launcher-driven onboarding achieves a 67% completion rate, the highest of any delivery mechanism, which maps directly to what the pragmatic early majority mindset predicts.
Late majority: ambient embeddable cards and contextual inline tooltips. Overlaid experiences signal complexity to a segment that's already skeptical. Inline guidance that appears within the product interface rather than on top of it respects their existing workflow. Users are 1.5x more likely to act on embedded in-app experiences than pop-up modals.
Laggards: social proof banners showing peer adoption rates among comparable accounts, combined with opt-in migration flows that make the rationale for change explicit. Guided tours and activation nudges will make things worse with this segment.
None of this works without behavioral segmentation. Without it, the five-segment playbook collapses into a single experience trying to serve five different adopter psychologies at once, and the experience that activates one segment will frustrate another. The filter criteria matter, too: activation depth, session recency, and feature breadth do more work than job title or plan tier, which are poor proxies for adoption stage. Manual workarounds exist (five separate campaigns, updated every time behavior shifts) but they don't scale. Chameleon's behavioral segmentation builds audience rules from live activation depth and session recency, so the right experience updates as users move between stages. No campaign rework required.
Use the adoption curve to time your GTM moves
The adoption curve is a feedback loop. What innovators adopt today typically becomes the early majority's table-stakes expectation within one to two product cycles — an observed heuristic rather than a measured interval, but consistent enough across SaaS product categories to use as a planning anchor. The behavioral signals covered earlier — activation depth, session recency, feature breadth — make that lag trackable: the innovator-profile patterns in your current cohort are a leading indicator of what your early majority will be asking for next year. Product teams that track that lag can sequence feature investment and deprecation timing against it, investing ahead of the early majority wave rather than scrambling to catch up when pragmatic buyers start asking for capabilities that innovators have been using for a year.
That lag also governs how you time feature announcements. The pattern that works: launch to innovators first, capture their use cases and edge cases, collect early adopter quotes and case studies, then expand messaging to the early majority with peer proof already built. Jumping straight to broad announcement without social proof is how features launch to silence.
The gap between when a feature ships and when late majority users discover it can be closed systematically. Trigger-based workflows that automatically surface the next relevant experience when a user reaches a behavioral milestone turn the adoption curve into an active operating instrument rather than a post-hoc diagnostic. Automations in Chameleon handle exactly this: a user completes onboarding, hits a feature activation threshold, or goes 14 days without logging in — and the system automatically surfaces the next appropriate experience without requiring a manual campaign. For teams thinking through how to roll out new capabilities to users already in-product, the post-launch feature adoption guide maps out the sequencing in detail.
Products that consistently move users from one stage to the next see compounding retention outcomes rather than one-time activation lifts. The Chameleon Benchmark Report connects in-app experience engagement to downstream retention metrics, giving product teams the evidence to argue that adoption curve management belongs on the product roadmap.
The feedback from innovators and early adopters also tells you which features will need the most support infrastructure when the late majority arrives, giving teams lead time to build help content before the volume hits.
In practice, product teams that track this lag systematically — tagging innovator-profile activation events and monitoring when the same behavioral patterns surface in later cohorts — catch the early majority wave weeks earlier than teams waiting for support ticket volume to signal demand. One team building onboarding tooling for mid-market SaaS used that lead time to build self-serve launcher content before their early majority cohort hit the feature, rather than retrofitting onboarding after users had already formed habits around workarounds.
Put the adoption curve to work with Chameleon
The adoption curve is an operating framework, and the practical gap is between knowing which stage a user is in and delivering the right in-product experience for that stage. That's where adoption rate improvements are won.
The specific capabilities that close that gap: behavioral segmentation rules built on activation depth and session recency, Launchers for self-serve early majority onboarding, Microsurveys for surfacing intent signals that clickstream data can't infer, and Embeddables for low-friction late majority guidance. Each of those tools maps directly to the stage-specific playbook covered throughout this article.
If you want to map your users to adoption stages and build the right in-app experience for each segment, book a demo or start a free trial to see how Chameleon handles it.
-
The adoption curve tells marketers when to shift demand-generation channels and messaging tone as the addressable market moves from innovators through mainstream segments. Innovators are reached via developer communities and API-first trials. Early majority buyers need established peer social proof. Late majority users respond to risk-reduction framing. The curve governs GTM timing as much as user psychology.
-
The five stages are innovators (2.5% of the market), early adopters (13.5%), early majority (34%), late majority (34%), and laggards (16%), as defined by Everett Rogers in Diffusion of Innovations (1962). Each segment adopts a product at a different point in its lifecycle and for different reasons, forming the bell-curve distribution that shapes the model.
-
The chasm is the gap between early adopters (visionaries who buy on potential) and the early majority (pragmatists who buy only on established peer proof), identified by Geoffrey Moore in Crossing the Chasm (1991). Most SaaS products stall here because early adopter social proof does not transfer to pragmatic buyers. Crossing it requires a fundamentally different selling motion and early majority-specific references.
-
Everett Rogers introduced the technology adoption lifecycle in his 1962 book Diffusion of Innovations, identifying five adopter segments and the factors that govern adoption speed. Geoffrey Moore extended the model in Crossing the Chasm (1991), adding the critical gap between early adopters and the early majority that the original framework did not fully address.
-
Early adopters are vision-driven and risk-tolerant. They buy on potential and will work with a product that is not fully polished. The early majority are pragmatic and risk-averse. They buy only after social proof from comparable peers is established and need the product to fit their existing workflow without requiring a significant behavior change upfront.
-
Use behavioral metric signals to identify which stage your current cohorts occupy, then sequence feature investment against the typical one-to-two product cycle lag between innovator adoption and early majority expectations. Time GTM channel shifts to match the segment you are actively expanding into rather than the one already converting. The third application is in-app experience design: triggered walkthroughs for early adopters who need vision confirmation, self-serve launcher checklists for pragmatic early majority users who want control over their own activation pace, and ambient embeddable guidance for late majority users who resist interruption. Stage-specific in-app experiences are what translate curve awareness into adoption rate improvements.