


How to use survey analysis to engage detractors and reduce churn
Cohort analysis is like baking a cake, where your tool is the oven, and your product is the end result. Once you serve it up, your users are your friends to whom you give a slice. How can you get their truthful feedback to improve the recipe next time, and keep them coming back for more?
Mouthwatering treats aside, cohort analysis is fundamental to deeply understand your user journey, and help identify areas where user engagement, adoption, and retention can be increased. User feedback is essential to cut out a lot of guesswork, and help you to analyze and make decisions based on real evidence that comes straight from the user’s click.
In this Recipe, we’ll explain exactly how to gather reliable feedback from your customers, and do cohort analysis to understand why they stay and why they leave.
If you stay till the end, you’ll get the cherry on top, where we’ll go full circle and use your findings to target relevant users in-app, helping to improve your customer loyalty and reduce churn.
The ingredients for success
A Chameleon account (Startup plan or above)
A Heap account (Free Trial, Pro or Premier plan)
Heap code snippet installed on the pages where Chameleon Experiences display
Step 1: Set up the Chameleon and Heap native integration
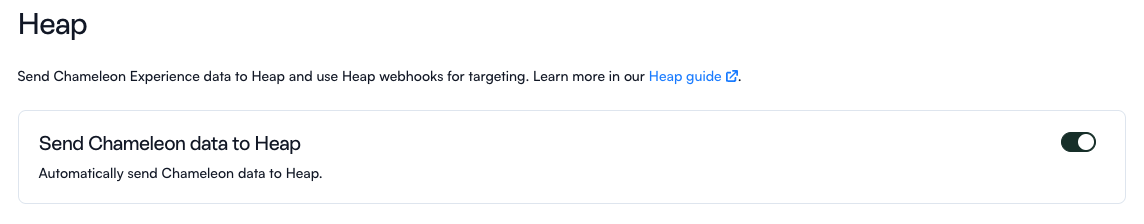
Heap and Chameleon have a native bi-directional integration, and the first step is to set up Heap as a data destination, which will allow you to send your Microsurvey events into Heap to analyze.
Head to the Heap integrations page in the Chameleon Dashboard and toggle on "Send Chameleon Data to Heap":
This data will be sent on pages where the Heap script is working, and you will see Chameleon events automatically flow into your Heap account in the Live View:
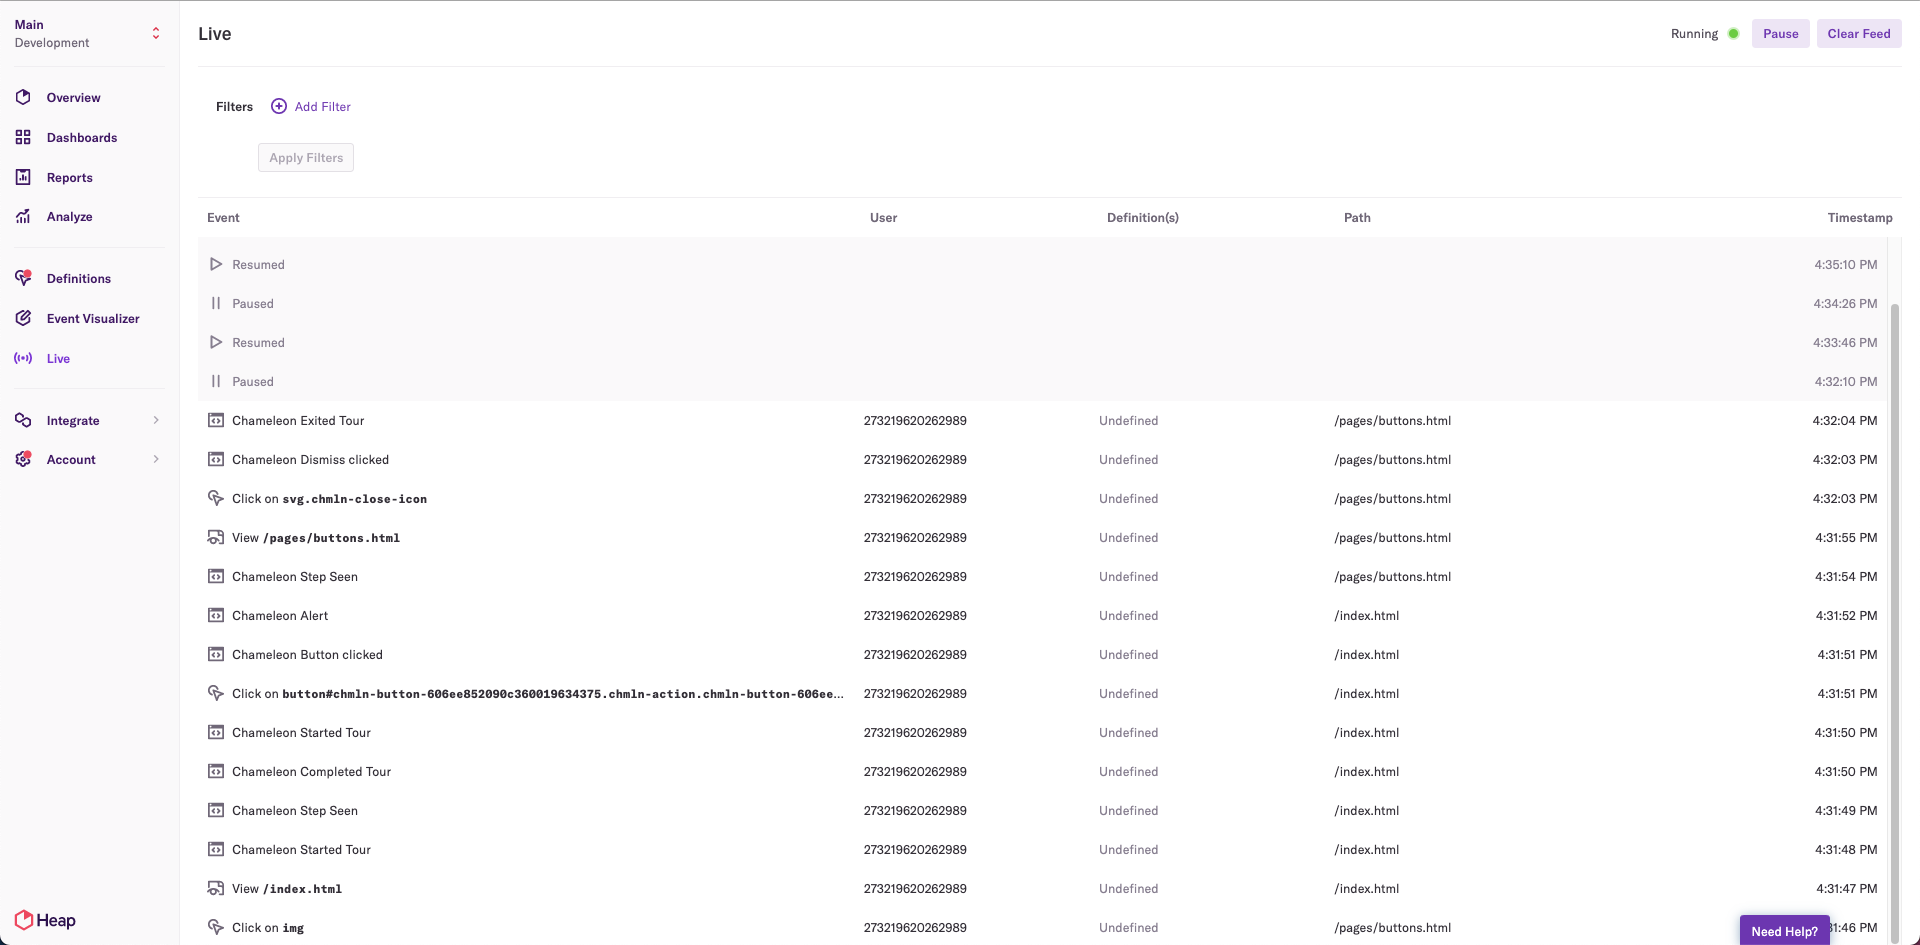
If your account was connected after July 2021, Heap automatically defines your Chameleon events. If your account was connected prior to this, head here to learn more about defining your events.
Step 2: Define your audience in Chameleon
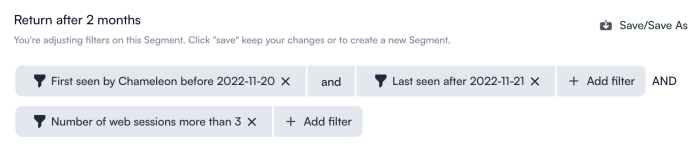
First off, create an audience of users to show your Microsurvey to. In this Recipe, we’re targeting engaged users who are actively using the product, and therefore more likely to give you relevant feedback. To do so, we’d create a Segment from within the Chameleon Dashboard of users who have returned to the product in 2 months - use the following filters :
Default properties > First seen by Chameleon > before > [select date 2 months ago]
Default properties > Last seen > after > [select date 2 months ago]
Number of web sessions > more than 3
Step 3: Create and launch a Chameleon Microsurvey
All Chameleon plans come with five types of Microsurvey:
Rating Microsurveys (including CES & CSAT)
Net Promoter Score (NPS)
Input (free-form text input)
Dropdown (many options)
Multi-Button (two/three/four/five-button surveys)
In this Recipe, we’re using an NPS survey to measure satisfaction over time. Watch this video for the steps to create and launch your survey, with bonus tips to help make it look fantastic ✨
Step 4: Start looking at your data
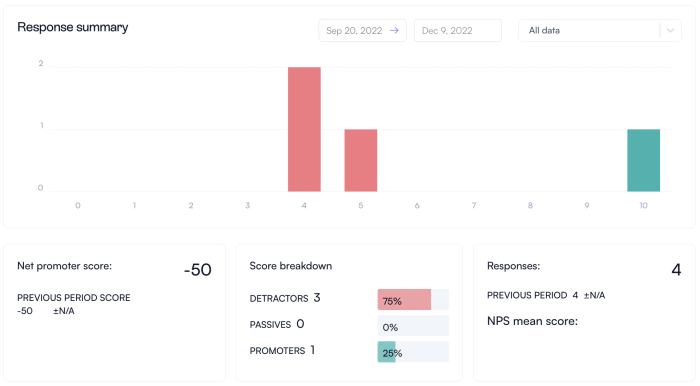
Head to your Chameleon Dashboard where you’ll find all the Microsurvey data and can view the NPS calculations based on the responses.
Chameleon collects data on Microsurvey events (e.g. Chameleon Microsurvey started every time a Microsurvey is seen by a user) and properties of events (e.g. button_text which contains the text of the button within a Microsurvey that was clicked by a user). You can see the full list of all Chameleon events here.
Step 5: Conduct cohort analysis on your findings
How does NPS score affect session to session user retention? Here’s how to use Heap to analyze:
Create cohorts in the Heap segment tool using NPS score results
Create the following three segments: Promoters (score of 9 or 10), Passives (score of 7 or 8), and Detractors (6 or below).
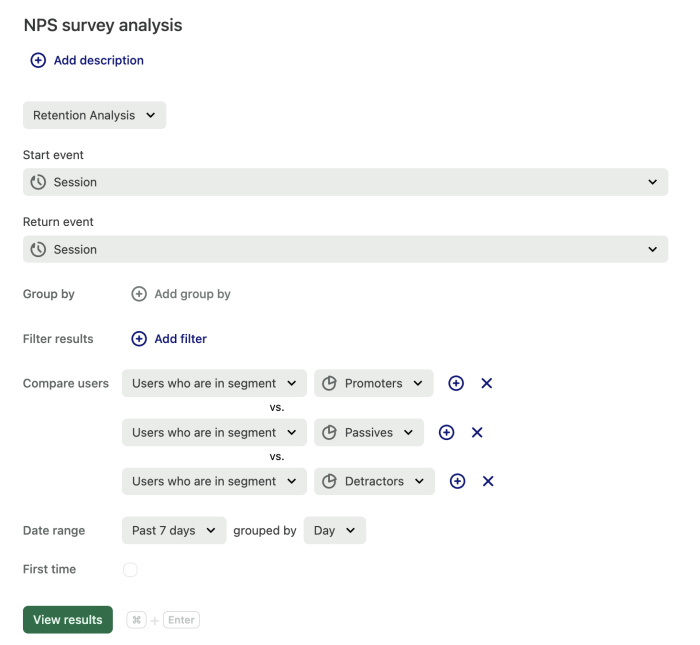
Create a Retention Analysis report to compare user groups
In the tool, click on “Analyze”, then “Retention”, then select "Session" as start event and "Session" as return event.
Click on “+ Compare user segments, and select “Promoters”, Passives, and Detractors - there will now be three cohorts to compare.
Select date range and how you'd like the data to be grouped (by day, week, or month).
Then you can view the results to compare the data on the three groups of users, to analyze how NPS results affect session to session retention.
Step 6: Target at-risk users in-app
Now you’ve performed your analysis, it’s time to act on the findings, and target detractors to minimize churn. One major reason that users are unhappy with your tool is lack of valuable onboarding - users lack sufficient knowledge, and don’t reach the “aha” moment or overcome the product adoption curve fast enough.
A great way to help users understand your tool is to provide them with a self-serve knowledge base from a Launcher, so they can quickly access help in-app. Follow these steps to create your Launcher and display it to these identified at-risk users:
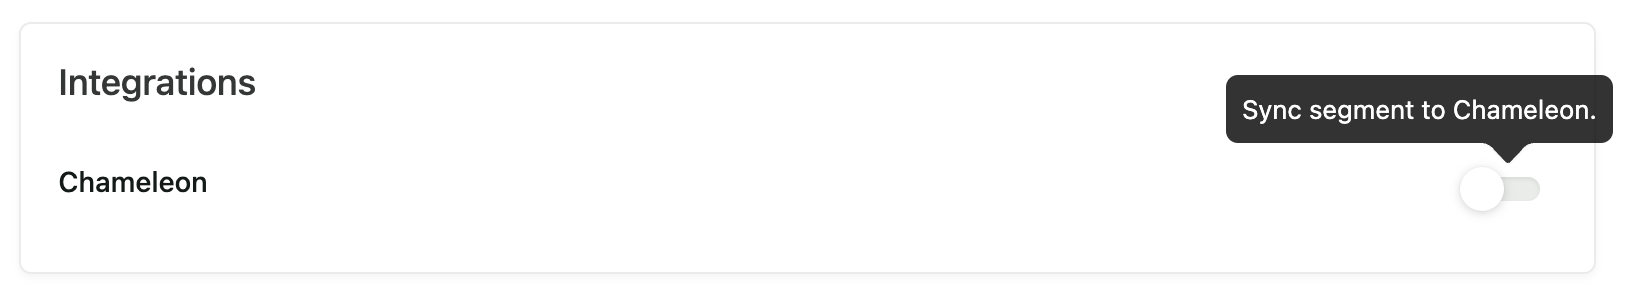
In Heap, go to the Detractors segment, click into the detail view, and toggle on the sync to Chameleon.
In Chameleon, go to Segments, add a new filter and click “Heap Segments”. Select “is a member of” and pick the “Detractors” Heap Segment. Save it as a new Segment, and name it appropriately.
Head to your Chameleon Launchers Dashboard, and click “+ Create a Launcher”.
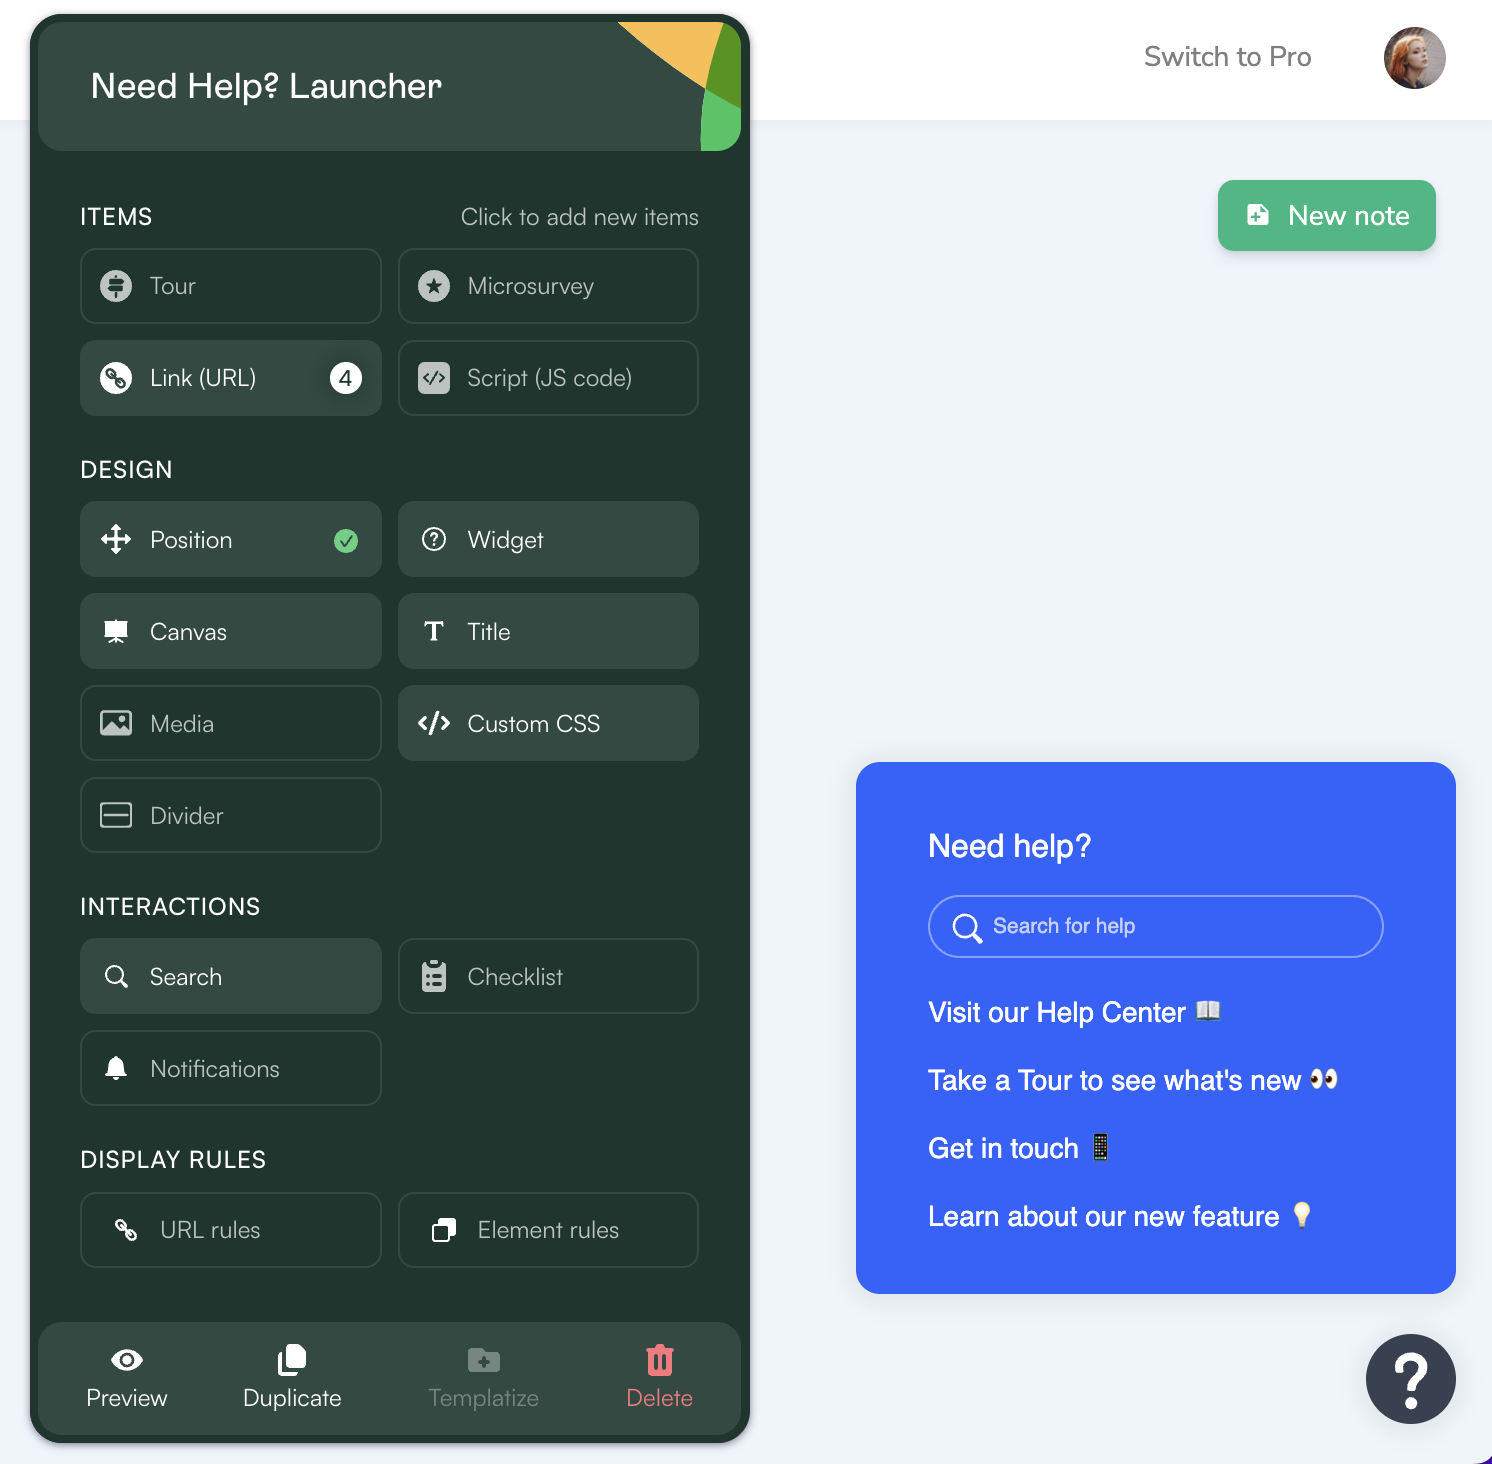
Click on Configure Launcher, choose the Help menu option, and you’ll head into the builder.
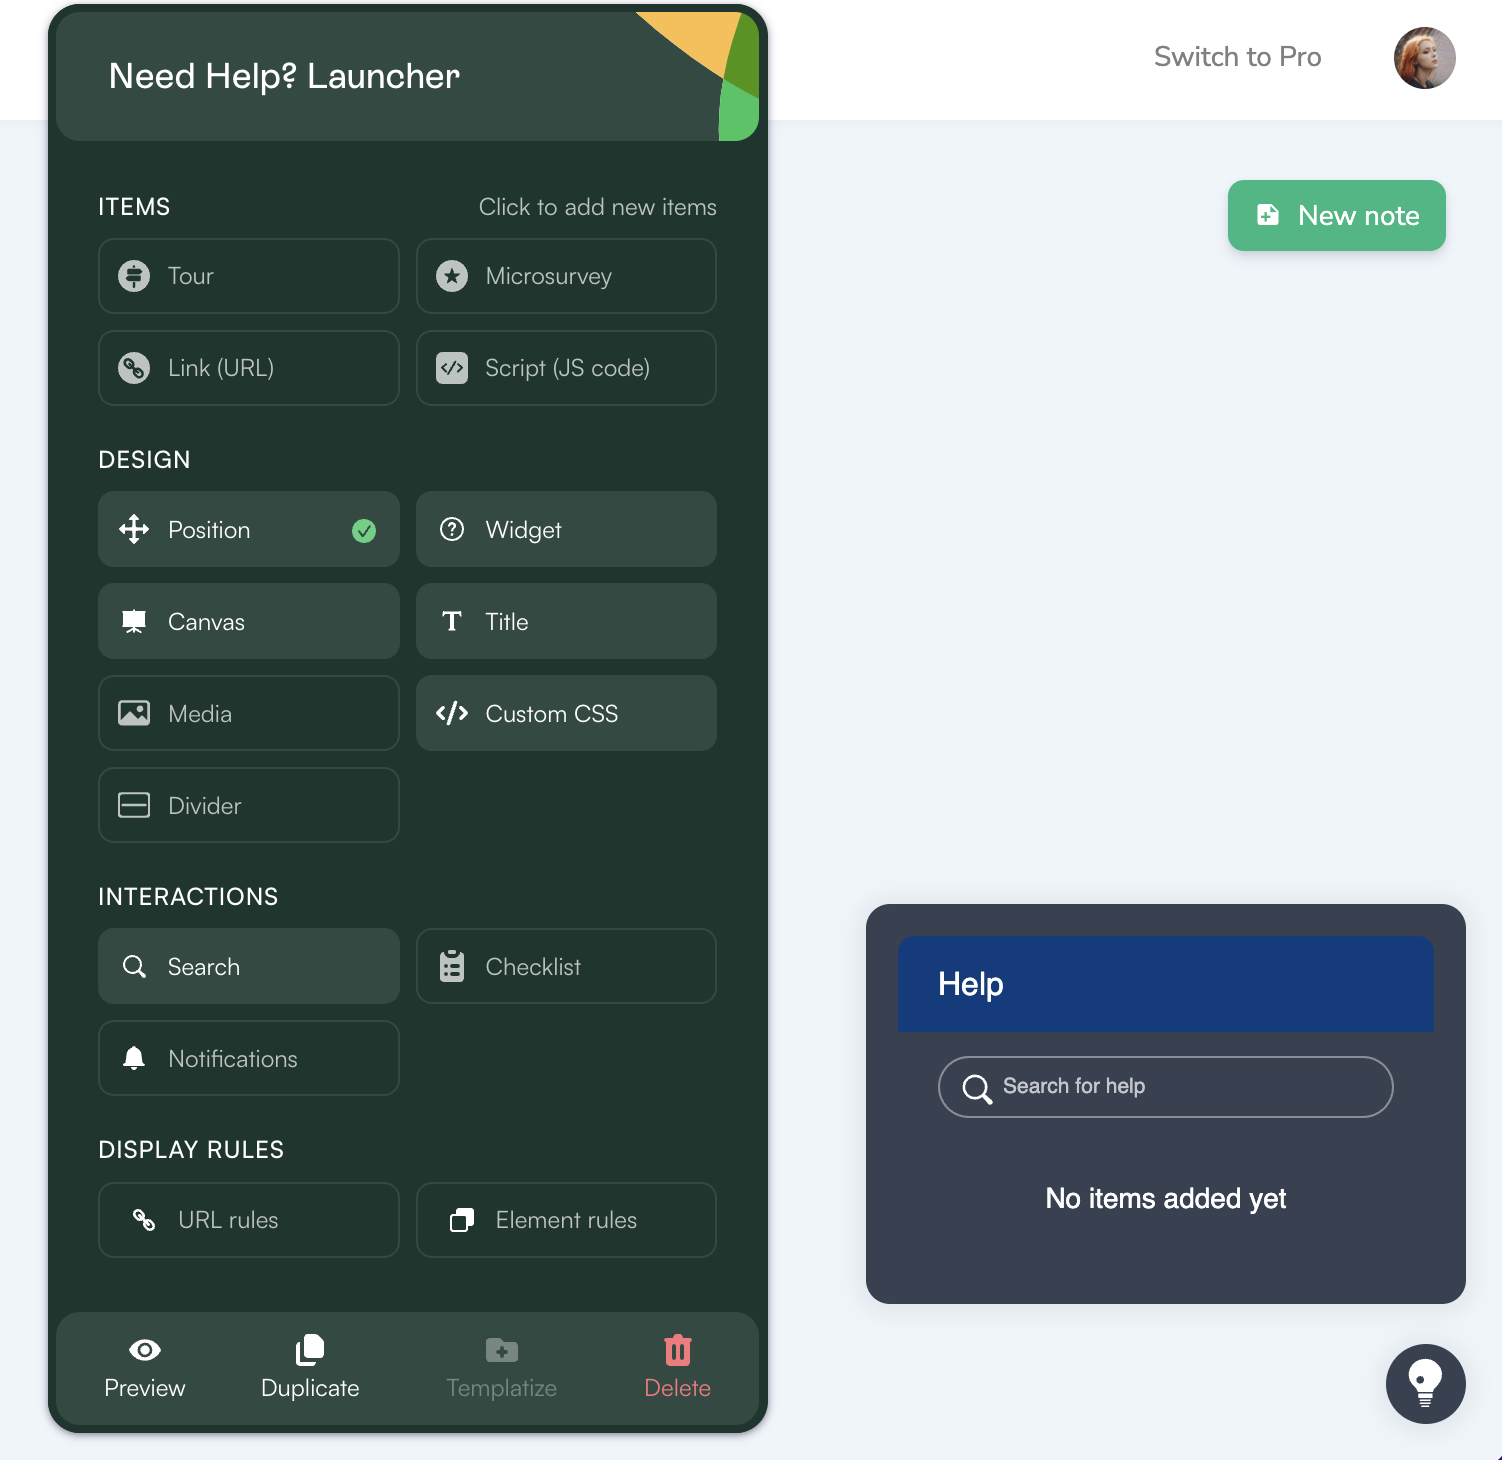
Click on Canvas and adjust the color to be on-brand while standing out so the user sees it. You can also adjust the width, height, and font size.
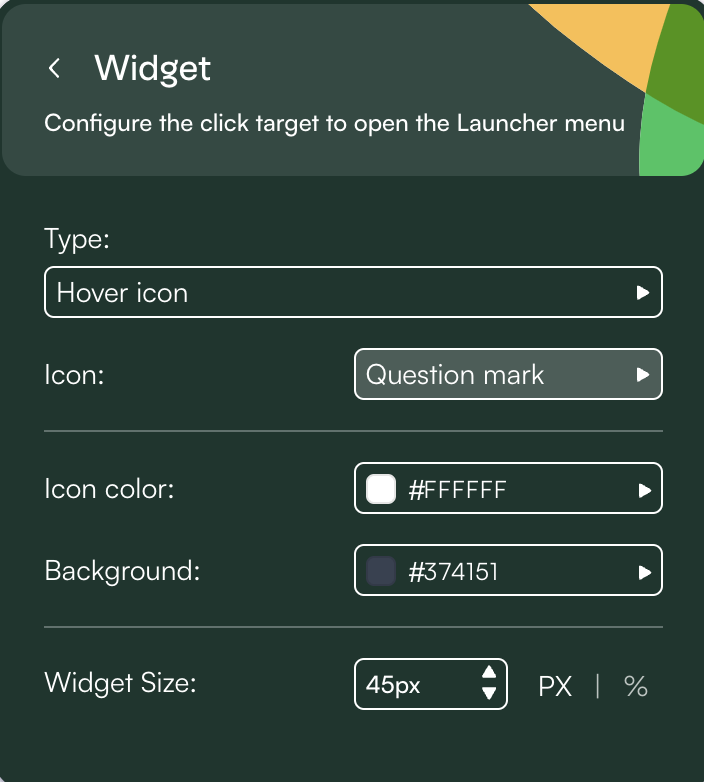
Change the Widget - a question mark would be appropriate to highlight what the Launcher contains, but you can choose something that is on brand with your help center and documentation.
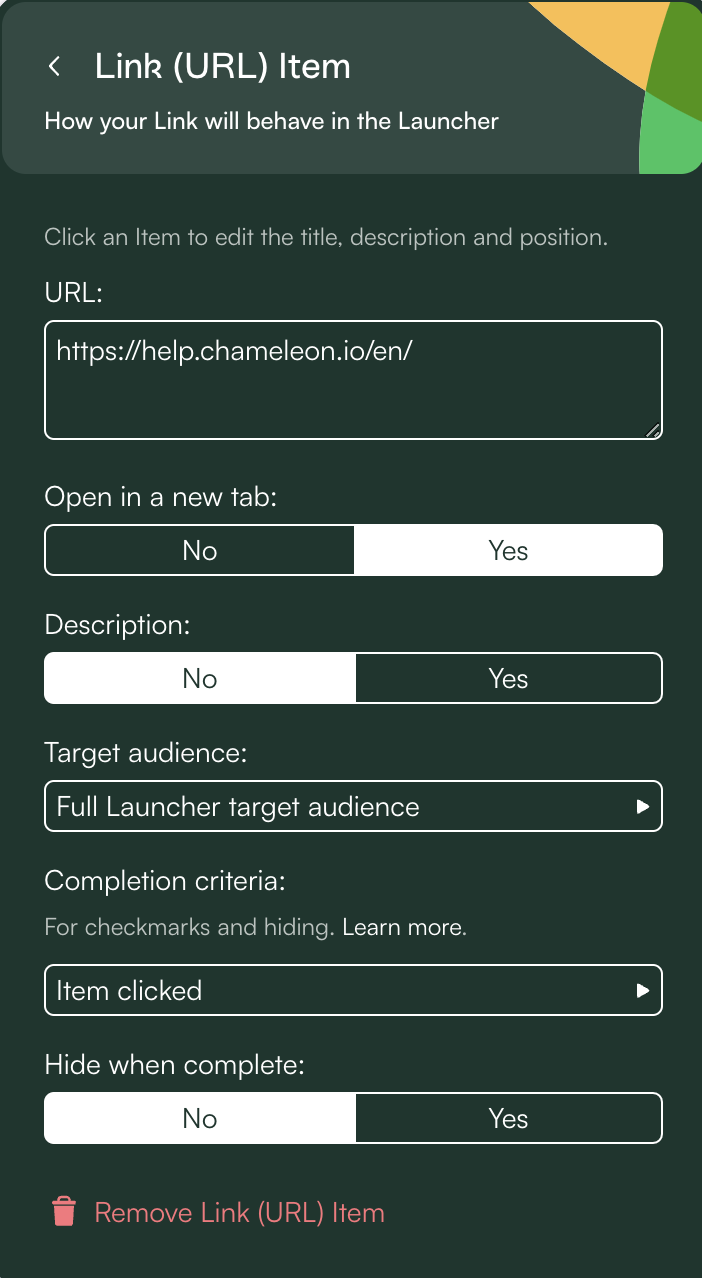
Click Link (URL) to add helpful links to your help centre, useful articles, new features, and quick access to your customer support team.
Add a Tour to guide users to discover new features in your platform that might help reengage them and show them added value.
And voila! You have your Launcher ready to go live.
Head back to the Chameleon dashboard, and select the environment you wish to push the Launcher too.
To define the audience, click Select segment, and choose the Detractors segment that you previously created.
Give it one final review, and then go ahead and publish.
You can continue to use the Chameleon and Heap integration to analyze the performance of your Launcher.
Conclusion
Nice job! You’ve now launched a successful NPS Microsurvey, performed cohort analysis to compare user groups, and then provided extra guidance to help detractors better understand your tool and help reduce churn.
Discover how you can increase trial conversion with the Chameleon and Heap integration, and schedule some time with our team to learn more.
