


Behavioral analytics help you understand what makes people tick, ick, and click. They're the fly on the wall, the big brother of apps and websites, the all-seeing eye – you get it. You need these to improve user experience and product development.
The question is:
Where do you start?
By reading this guide. Here, you'll learn about:
What behavioral analytics are, how they work, and why they’re important
The metrics you need to track
The behavioral analytics software types you need for different products and goals
Strategies to make the most of your user behavior data
In a hurry? Here are some highlights 🏃
Behavioral analytics track users' clicks, scrolls, and navigation patterns. This data helps you identify and resolve usability issues.
Behavioral data can guide product and design iterations that maximize user satisfaction and boost conversion rates.
Tools like heatmaps, session recordings, and A/B testing help visualize and analyze user behavior, allowing you to minimize friction, optimize user flows, and improve UX.
Here to stay? Let’s get into it!
What are behavioral analytics?
Behavioral analytics involves tracking and understanding how users interact with a digital product or service to gain insights into their behavior.
You can set up behavioral analytics to better understand how users engage with your website, mobile app, software as a service (SaaS) product, or any other digital platform. They allow you to identify patterns, optimize user experience (UX), and make data-driven decisions to address users’ needs better. Additionally, behavioral analytics enables organizations to enhance security and protect their digital resources by providing insights into employee actions and customer interactions.
Behavioral analytics are like seeing a maze from above: they enable you to observe the wrong turns that get people stuck, which routes they choose, and how long it takes participants to find their way through the maze.
Having this bird' s-eye view of your users’ actions helps you refine usability and improve the UX, making it less like a maze and more like a bridge.
Ensuring impeccable user experience is the foundation of creating a solid base of happy customers. Behavioral analytics captures the sentiment of UX and helps you find issues with the journey you’ve currently set in place – but how?
Examples of user behaviors relevant to behavioral analysis
Behavioral analysis is about understanding users' actions and decisions as they interact with your digital products. By examining these behaviors, you can gain valuable insights into how users engage with your offerings and identify areas for improvement. Here are some key examples of user behaviors that are particularly relevant to behavioral analysis:
Clicking on a Call-to-Action (CTA) Button: indicates user interest and intent, helping you understand which CTAs are most effective.
Filling Out a Form or Survey: This behavior shows user willingness to provide information, which can be crucial for lead generation and customer feedback.
Abandoning a Shopping Cart: This is a critical behavior to analyze, as it can reveal friction points in the purchasing process.
Signing Up for a Newsletter or Subscription: indicates user engagement and interest in ongoing communication.
Purchasing a Product or Service: This is the ultimate goal for many businesses, and understanding the path to purchase can help optimize conversion rates.
Engaging with Social Media Content: This behavior can provide insights into user preferences and the effectiveness of your social media strategy.
Watching a Video or Tutorial: This shows user interest in learning more about your product or service, which can inform content strategy.
Downloading a Resource or E-book: This indicates user interest in your content and can be a lead-generation opportunity.
Participating in a Webinar or Online Event: This behavior shows high engagement and interest in your offerings.
By analyzing these behaviors, you can better understand how users interact with your digital products and identify opportunities for growth and improvement.
How do behavior analytics work to analyze user behavior?
To monitor your users’ behavior, you’ll need a proper behavioral analytics solution – aka behavioral analytics software. These tools get you the inside intel by tracking users’ actions when interacting with your website or product. They collect data on different user actions, including:
How far users scroll on a page
Which elements do users click on
Frustration-born clicks
User preferences
And more.
Next, your behavior analytics software will aggregate and help you make sense of the collected data. It will identify patterns, trends, and user flows that show you, for example, the most common user paths users take to reach a conversion.
The analytics solution will display all this data through easy-to-understand visual reports that help you answer questions like:
What frustrates first-time users?
Why do users abandon their carts?
Which pages of your website trigger a visit ending?
Which features are the most useful for your user segments?
In short, specialized software tracks all the data you need and presents it to you in reports. All you have to do is let the user behavior data guide your product development decisions.
If you still don’t see the value in setting up behavioral analytics at the product or website level, the following section will convince you otherwise.
Why are behavioral analytics so important for your business?
Without behavioral analytics in place, you only get half of the story. Your website analytics will only tell you things like:
Number of visitors to your site over a specific period
Total page views across your website
Bounce rate, showing how many visitors leave without interacting
Average session duration, indicating how long users stay on your site
Traffic sources telling you where visitors are coming from
Circling back to the maze analogy, these metrics would only count the people who get in and out and how much time they spend inside the labyrinth. To know what your customers or users experience while they’re trying to find the right path, you’ll need to monitor customer behavior inside the winding walls.
Collecting raw data is essential as it is the foundational input for analyzing user interactions across various digital platforms.
Monitoring user behavior helps you:
Improve UX: identify user pain points and preferences to inform design changes (for example, collect contextual feedback in critical moments)
Streamline product development: see which features are popular and which are underused, detect and remove obstacles in your user flows, and understand which part of your products need improvements
Optimize your marketing efforts: focus on granular user segmentation to optimize your product for growth
The collected user data can be used to boost sales, increase conversions, reduce churn rates, or improve the user experience.
Now you understand how user behavior analytics works and why they are important. What’s next? Where do you start, and what should you track? Read on!
How to collect and integrate user behavior data
Collecting and integrating user behavior data is a critical step in behavioral analysis. This process involves gathering data from various sources to understand how users interact with your digital products comprehensively. Here’s how you can effectively collect and integrate user behavior data:
IT users and customer data
To get a complete picture of user behavior, you must collect data from IT systems and customer interactions. This includes:
User Activity Logs: Track user actions within your application to understand how they navigate and use different features.
System Logs: Monitor system performance and errors to identify technical issues that may affect user experience.
Network Traffic Data: Analyze network data to understand how users access your services and identify any bottlenecks.
Customer Feedback and Survey Data: Collect direct feedback from users to gain insights into their experiences and preferences.
Social Media Data: Monitor social media interactions to understand user sentiment and engagement.
Website Usage Data: Use web analytics to track user behavior on your website, including page views, clicks, and session duration.
This data can be collected through various methods, including:
Web Analytics Tools: Tools like Google Analytics help you track and analyze website traffic and user behavior.
Customer Relationship Management (CRM) Software: CRM systems like Salesforce store customer interactions and data, providing valuable insights.
Social Media Listening Tools: Tools like Hootsuite and Sprout Social help you monitor and analyze social media activity.
Survey and Feedback Tools: Platforms like SurveyMonkey and Typeform allow you to collect and analyze user feedback.
Data Warehouses and Business Intelligence Platforms: Solutions like Snowflake and Tableau help you store and analyze large volumes of data.
Third-party data vs. first-party data
When it comes to data collection, it’s important to understand the difference between third-party and first-party data:
Third-Party Data: This data is aggregated by other companies and sold to businesses. While it can provide broad insights, it may not be as accurate or relevant as data collected directly from your users.
First-Party Data: This data is collected directly from your users through their interactions with your digital products. It provides a more authentic and detailed understanding of user behavior, preferences, and intentions.
First-party data is essential for behavioral analysis because it allows you to understand your users better and make more informed decisions based on their actual behavior.
Integrations that behavioral analytics tools should work with
To maximize the value of your behavioral analytics tools, they should integrate with various external sources. These integrations enable you to combine behavioral data with other relevant data sources, providing a more comprehensive understanding of user behavior. Key integrations include:
Data Warehouses and Business Intelligence Platforms: Integrate with platforms like Snowflake and Tableau to store and analyze large volumes of data.
CRM Software: Connect with CRM systems like Salesforce to combine behavioral and customer interaction data.
Marketing Automation Platforms: Integrate with tools like HubSpot and Marketo to align behavioral data with marketing efforts.
Social Media Management Tools: Use tools like Hootsuite and Sprout Social to analyze social media interactions alongside other user behaviors.
Customer Feedback and Survey Tools: Connect with platforms like SurveyMonkey and Typeform to incorporate user feedback into your analysis.
A/B Testing and Experimentation Tools: Integrate with tools like Optimizely and VWO to test and optimize different aspects of your digital products.
Heatmap and Session Replay Tools: Use tools like Hotjar and Crazy Egg to visualize user interactions and identify areas for improvement.
By leveraging these integrations, you can create a holistic view of user behavior and make more informed decisions to enhance user experience and drive specific business outcomes.
6 Types of behavioral analytics for tracking user experience [+ the behavioral analytics tools to help you get the job done]
1. Marketing metrics
If you’re running a marketing campaign, many of your customers' experiences will begin when they see your ad. Whether it leads them to a blog post on your website or directly to a sign-up form, that’s the first point of contact, and you should have that on your radar.
Metrics that help you monitor the effectiveness of your ads include:
Conversion rate: indicates how many people complete a desired action after clicking on your ad. It tracks things like purchases, form submissions, or sign-ups.
Post-click engagement: tracks the actions people do after clicking on your ad and helps you determine how efficient your landing page content is
Click-through rate (CTR): measures the percentage of people who click on your ad after seeing it. A high CTR means your ad is relevant to your target audience.
Depending on your channel, you can use Google Analytics, Facebook Pixel, Instagram Insights, or any other analytics tool to help you learn how well your ads are performing and whether some types of ads are more successful.
You can also use A/B testing tools to experiment with different versions of your campaigns, landing pages, or designs. A/B testing will clearly show which of your solutions works better for customers. This approach is perfect for testing the effectiveness of landing pages, PPC ads, email sequences, and new feature announcements.
To start with A/B testing, create two or more versions of your design and use analytics to see which yields better results. Here’s an example of how A/B testing results can look like.

This A/B experiment was run through Amplitude, an A/B testing and product experimentation platform. In this example, the test analyzed two variants to determine which can increase the number of unique conversions at cart checkout. From the results, we can see that variant A outperformed variant B.
2. Landing page interactions
Turning website visitors into customers is where landing page optimization plays its role. Keeping conversion rates high ensures that your marketing efforts are paying off.
For example, if you bring 1,000 potential clients to your landing page and turn 50 of them into customers, your conversion rate is 5%. However, if you’re bringing 3,000 customers to your funnel yet only getting 30 customers, your conversion rate is 1%. Your landing page needs some optimization to get to the average landing page conversion rate of 2.35% or higher.
Heatmaps-generating tools can help you reach better conversion rates on your landing pages. They enable you to see how prospective customers behave on the landing page, where they’re handing out, what they find interesting, and where they’re trying to click.
This is what a heatmap that tracks clicks on a webpage looks like.

Heap, a popular behavioral analytics platform, generated this click map. The blue and green zones represent the least clicked elements, whereas the yellow, orange, and red spots indicate high-activity areas on the web page.
These tools can help you organize on-page information, fix broken buttons (or make new items clickable), and find the ideal landing page length by identifying how far down your LP most users scroll.
3. Combatting product churn rates
Churn rates represent the percentage of people who leave your product and never return. This can happen during the activation flow or onboarding steps, at the end of the free trial, or at any other point in the process.
Use session recording tools to pick up the users’ behavior and discover navigation patterns, frustrations, and roadblocks they experience while using your product.
The analysis of recordings will clearly show how your users interact with your product’s UI. You’ll be able to easily conclude what parts of the interface could be improved for improved UX and reduced churn rate. Look at what a session recording looks like in Mixpanel, a product analytics software solution.
This guide contains everything you need to know about user onboarding metrics.
4. Product usability & retention
Product usability is essential for every SaaS tool. Detecting and fixing bugs is the best way to show users that you care about their experience.
Specific user behavior monitoring tools will report bugs in the user experience. At the same time, you can use heatmaps to see whether there’s repeated clicking on a button that’s not working. If you follow the users throughout the session, you can also notice rage quit patterns.
It can be difficult to watch everything closely if you have hundreds of thousands of users. Try product analytics tools like Mixpanel and Amplitude to generate reports to help you detect common issues with in-app behavior.
Along with analytics tools, you can also use friction logging as an effective way to detect negative friction and start working on improvements.
Are you curious about what performance indicators you should track to monitor your SaaS product effectively? Check out this guide on SaaS metrics.
5. User satisfaction
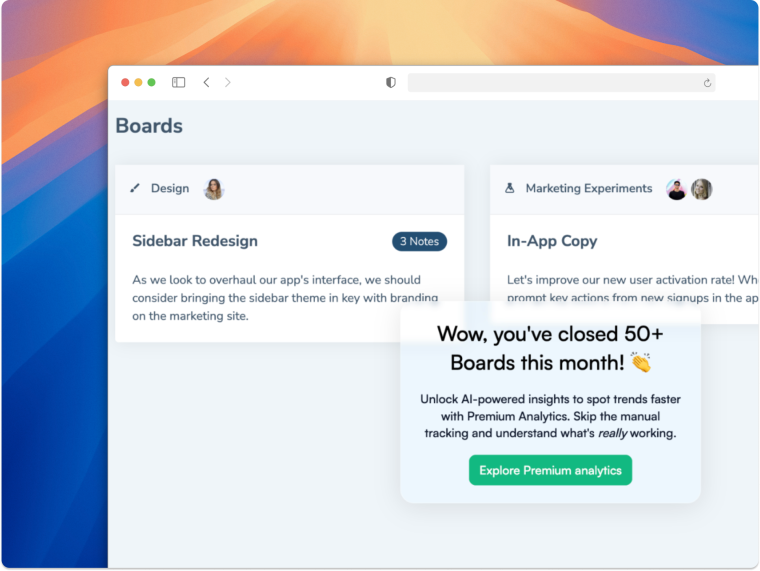
Measuring user satisfaction is best done by asking customers how they feel about using your product.
Use tools like Chameleon to build and deploy in-app surveys to collect contextual feedback directly from your app. You can set them up at key moments based on your users’ actions.
Let’s say Hotjar is your user behavioral analytics tool of choice when you launch a new feature. The data shows that many users repeatedly click on the same button. After countless angry clicks and clacks, they leave.
What’s going on? As possible scenarios flood your imagination, you ask yourself, and your forehead breaks into cold sweat droplets.
Instead of letting your mind run loose and creating apocalyptic scenarios about your product, you could ask your users what’s up through an in-app survey that pops up as the frustrating clicks intensify.
For example, you could use Zapier to trigger a Chameleon in-app survey when Hotjar starts recording angry users clicking their rage away.
It’s a great way to get users' feedback immediately and learn more about your product quality. This will point you to the parts of your product that need immediate attention.
6. User flow analysis
User flow analysis helps you identify users' most common ways to act while using your digital product. These tools record and display your users' steps in a visual report, like the one in the image below.
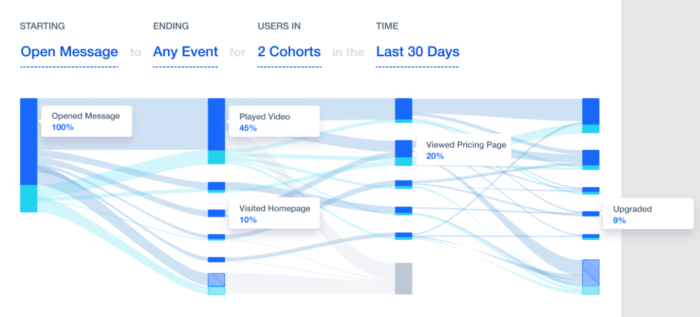
This user flow created with Mixpanel showcases the actions performed by users over 30 days – from watching a video on the homepage to upgrading their subscription.
This kind of user behavioral data can help you discover and address friction points to improve UX and conversion rates.
The path to a hyper-targeted and relevant UX with Mixpanel and Chameleon
Discover how Chameleon's integration with Mixpanel can help you take your in-product experience to the next level.
Speaking of improving UX…
How to improve user experience with behavioral analytics
Setting up a behavioral analytics tool will do little for you. It’s what you track and what you do after with the data that will help you improve UX. Follow these five steps to make the most of your analytics:
Monitor different stages of the customer journey: don’t stop at conversions. Track customer behavior through the awareness, consideration, and post-purchase stages to identify when they need additional nurturing or a helping hand (that stops them from rage-clicking).
Use various analytics measuring methods: different parts of your product funnel will require different approaches, so use the right tools and tactics to examine user behavior from all angles.
Analyze insights and find patterns: if you’re just starting, let some time pass to accumulate the right amount of data that enables you to come to conclusions. For established customer bases, track metrics consistently to uncover trends and predict future behaviors more accurately.
Apply your user experience solutions based on insights: don’t let your data collect dust. Use it to inform and guide your UX decisions. Is a button not working? Fix it. Does nobody click your CTA? Adjust its position.
Measure your results and reiterate: you’ll be able to notice the changes after each iteration you make. This enables you to take action and improve problematic areas you’ve identified.
Now, you have the metrics, the tools, and the step-by-step process to make the most of behavioral analytics. Let’s wrap this up.
Inform decision-making and enhance user experience with behavioral analytics to identify patterns
Behavioral analytics are the key to your users' hearts (and minds). They help you understand what’s behind clicks, scrolls, and drop-offs.
With user behavioral analytics, you can identify the sources of user frustration and turn them into opportunities for product improvement, helping you grow your user base over time.
Combine behavioral analytics with Chameleon's contextual in-app surveys and support to get closer to your users.
Explore Chameleon's integrations and find the perfect match for your behavioral analytics tool:
Thanks for reading!

Do users love your product?
Deploy a feedback survey in minutes and find out!


