


Ever wonder why users abandon your onboarding process halfway through? Or what keeps them from clicking that "upgrade" button? Frustrated users often leave silently, leaving you scratching your head with limited data.
But what if you could go beyond educated guesses and see exactly how users interact with your product?
We understand the struggle. That’s why we’ve put together the best 15 product analytics tools to help you see user behavior firsthand and, ultimately, create a product your users love.
Tool | Best for | Key features | Pricing (starts at..) | G2 rating |
Heap (by Contentsquare) | Automatic data capture and analysis |
| $2,500-$3,000/month | 4.4 / 5 |
PostHog | Developer-centric product analytics |
| Flexible, usage-based pricing, which starts at $0.00005/event | 4.4 / 5 |
Mixpanel | User behavior tracking |
| Free, Growth: $28/month | 4.6 / 5 |
Amplitude | User journey insights |
| Free, Plus: $61/month | 4.5 / 5 |
InnerTrends | Pre-built analytics reports |
| Free, Startup: $79/month | 4.7 / 5 |
Google Analytics | Web data tracking |
| Free, GA360: ~$50,000/year | 4.7 / 5 |
Snowplow Analytics | Event data collection |
| Open-source: Free, Behavioral Data Platform (BDP): ~$37,500/year | 4.6 / 5 |
Tray.io | Integration and automation |
| $2,500/month | 4.5 / 5 |
Iterable | Cross-channel customer engagement |
| ~$500/month | 4.6 / 5 |
Segment | Simplifying data collection |
| Free, Team: $120/month | 4.5 / 5 |
Zapier | Automation |
| Free, Paid: $19.99/month | 4.5 / 5 |
FullStory | Digital intelligence |
| ~$300-$1,000/month | 4.5 / 5 |
Hotjar | Visual data collection |
| Free, Paid: $59/month | 4.3 / 5 |
Pendo | Product experience platform |
| ~$2,000/quarter for 2k Monthly Active Users (MAU) | 4.4 / 5 |
LogRocket | Front-end application monitoring |
| Free, Paid: $99/month | 4.6 / 5 |
Top 15 product analytics tools to guide product development
Product managers, we've got you. We've analyzed the top product analytics tools based on features, integrations, pricing, and user buzz. This curated list will help you pick the ideal partner to understand your users and build a product they'll love.
1. Heap (by Contentsquare): for automatic data capture and analysis

Heap automatically captures user interactions across web and mobile applications. It records every click, swipe, form fill, and page view without requiring engineers to set up custom tracking. This allows teams to examine historical data for insights they may not have initially considered.
Heap is user-friendly, with a low-code interface that enables non-technical teams to access and analyze data easily. It also includes data science capabilities that automatically surface insights about user friction and opportunities for improvement.
Key features
Automatic data collection: captures all user interactions without manual tagging
Journey analysis: visualizes user paths through the product
Session replay: provides detailed playback of user interactions
Data science and insights: identifies hidden opportunities and friction points
User segmentation: groups users based on behaviors and properties
Heatmaps: visualizes clicks, scrolls, and user attention
Funnel analysis: tracks user progression through conversion funnels
Effort analysis: quantifies user friction to highlight areas where users struggle, allowing immediate fixes to improve the user experience
Retroactive analysis: allows analysis of historical data without prior setup
Integrations
Heap integrates with tools like Chameleon, Salesforce, HubSpot, and Slack to ensure smooth data flow between your existing systems. You can import and analyze data from multiple sources to gain insights and simplify your workflows.
How Heap integrates with Chameleon
Connect these tools to track how users interact with your Chameleon Experiences (tours, surveys) within your product data. Analyze user journeys, pinpoint drop-off points in your experiences, and iterate faster for better user engagement.

No more guesswork, just clear insights and better engagement
Deploy in-app campaigns that convert with Heap and Chameleon. Get visibility over how tours impact every KPI that matters 📊!
Pricing
Heap doesn’t list its prices online. According to a Reddit user, in 2023, the paid plans cost between $2,500 and $3,000 per month for the first year. The good news is that some fees are one-time, so costs drop in the following years, saving you a lot. Of course, it all depends on how many users and events you’re tracking too.
Heap ratings and reviews
G2 rating: 4.4 / 5 stars, based on 1,085 reviews
Sashank K. says, "Heap is amazing at running queries at lightning speed on event streams. The customer support team is also one of the most proactive and helpful I've encountered."
2. PostHog: Best for developer-centric product analytics
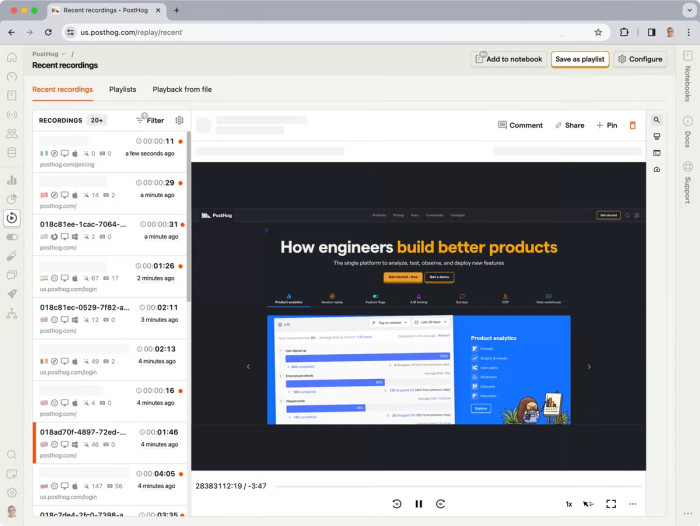
PostHog makes tracking and analyzing user behavior a breeze. It integrates session replays, feature flags, A/B testing, and surveys into one platform.
What sets PostHog apart? It’s open-source, giving you full control over your data and the flexibility to tweak it to your heart’s content—perfect for data privacy and compliance! PostHog can be self-hosted, putting you in the driver’s seat.
Key features
Web analytics: gain marketing-focused insights for website performance tracking
Session replay: watch recordings of user interactions to understand their experience
Feature flags: roll out new features to specific user groups for controlled testing
A/B testing: run experiments to compare product variations and optimize user experience
Surveys: collect qualitative feedback directly from users within your product
Event tracking: capture user interactions automatically or with custom-defined events
User segmentation: group users based on behaviors and properties for targeted analysis
API access: integrate PostHog data and functionality into your applications
Integrations
PostHog connects with major data warehouses like Snowflake and BigQuery and collaboration tools like Slack and Teams. It also supports customer data platforms like Segment and marketing tools like HubSpot, so your data flows smoothly across your favorite systems.
Pricing
PostHog uses a flexible, usage-based pricing model rather than fixed plans. It starts with generous free tiers at $0 per month and charges based on usage. For example, product analytics cost $0.00005 per event, session recordings are $0.04 each, and feature flag requests are $0.0001 per request.
Rating
G2 rating: 4.4 / 5 stars, based on 507 reviews
Camilo P. says, "PostHog is an incredibly useful and easy-to-use analytics platform. The wide range of features lets us track and analyze user behavior across our product, providing valuable insights to guide our decision-making."
3. Mixpanel: Best for user behavior tracking

Mixpanel is your go-to powerhouse for cracking the code on user behavior in web and mobile apps. Want to track what really matters? Set up custom key performance indicators (KPIs) and let Mixpanel do its magic.
These indicators can focus on milestone events within your application, including events like “profile created” and “5+ messages sent.” From this data, you can see where your product shines and where it needs polishing.
Mixpanel is a dream for product teams ready to dive deep into user behavior. It’s the ultimate tool for product-led growth, helping you analyze, measure, and perfect customer experiences. Plus, its pretty accessible for other teams to use independently.
Mixpanel published an in-depth guide on product analytics—there's some brilliant information in there to dig into and share with your team.
Key features
Funnels: tracks user progression through conversion paths and identifies drop-off points
Cohort analysis: analyzes user behavior over time, measuring retention and engagement
Lexicon: organizes and documents events and properties to ensure data consistency and clarity
Recurring Messages: sends automated messages based on user behavior to drive specific actions
In-depth data analysis: machine learning for uncovering insights and suggesting product improvements.
SDKs and APIs: provides developer tools for streaming data directly from digital products
Integrations
Mixpanel integrates with data warehouses like Snowflake and BigQuery, collaboration tools like Slack and Teams, customer data platforms like Segment, and marketing tools like HubSpot. It also connects with platforms like Salesforce and Chameleon to enhance user tracking and engagement.
How Mixpanel integrates with Chameleon
Find out how your in-app messages and tours impacting user behavior? Chameleon experiences (tours, surveys) send user engagement data directly to Mixpanel's powerful analytics dashboard. This lets you see how users interact with your Chameleon elements and create user segments based on their app behavior within Mixpanel. You can then target these segments with personalized Chameleon experiences for maximum impact.

"Users who have seen Chameleon Experiences have a 4% higher retention rate!"

Wish your app could whisper sweet nothings (or targeted messages) to different user groups?
With user groups identified by Mixpanel, Chameleon lets you craft targeted tours, surveys, and messages that address each user's specific needs.
Pricing
Mixpanel offers a free plan for up to 20 million monthly events and a Growth plan starting at $28 per month for 10,000 events, scaling with usage.
Rating
G2 rating: 4.6 / 5 stars, based on 1,099 reviews
"Mixpanel makes data analysis and visualization easy and beautiful. The dashboard tool is great for at-a-glance visuals of our product," says Mike M., Chief Product Officer.
4. Amplitude: Best for user journey insights

Imagine every tap, swipe, and purchase in an app as part of a user's journey. Amplitude analyzes data from millions of these journeys! What makes Amplitude the ultimate partner for product teams? It actively analyzes your sales funnel at every stage, pinpointing bottlenecks and areas for improvement. This ensures a smooth conversion process from start to finish.
Product managers can track the impact of innovative experiments and new features, ensuring every move is data-driven and impactful.
H4: Key features
Event segmentation: analyze specific user actions and behaviors within your product
Cohorts and audiences: create and analyze groups of users based on shared traits or behaviors
Pathfinder: visualize user journey paths and event sequences
Automated reports: access instant insights with industry-specific templates
Real-time data processing: access up-to-date insights on user behavior
Behavioral cohorting: group users based on specific actions or traits
Integrations
Amplitude integrates with various tools, including Google BigQuery, Amazon Redshift, Snowflake, Google Cloud Storage, AWS S3, HubSpot, Mailchimp, Klaviyo, and Customer.io. It also supports Adobe Launch, Google Tag Manager, Slack, and Teams.
How Amplitude integrates with Chameleon
Amplitude and Chameleon integrate for user experience analytics and in-app guidance. Here’s how:
Chameleon tracks user engagement with tours, messages, and more. It then sends that data to Amplitude for deep analysis.
Amplitude goes beyond basic stats. It identifies user groups based on their behavior, allowing you to target specific segments with Chameleon.
Think VIP experiences! Create customized tours, surveys, and messages that resonate with varied user needs.
Data + Action = Happy users
Amplitude listens closely, analyzing user behavior and identifying key interactions. Chameleon takes action!
Pricing
Amplitude offers a free Starter plan with features like product analytics, session replay, and unlimited feature flags. The Plus plan starts at $61 per month and includes advanced analytics, custom dashboards, and online support.
Rating
G2 rating: 4.5 / 5 stars, based on 2,132 reviews
Hagay R., a small-business user, says, "Amplitude is incredibly user-friendly, making it easy to connect and start using without complications. You don't need in-depth knowledge to begin enjoying its features."
5. InnerTrends: Best for pre-built analytics reports

InnerTrends is an alternative to traditional analytics tools for two key reasons.
First, all of its analytics reports are ready to use, giving product folks faster, “spoon-fed” insights into product usage. This saves time and effort on building or customizing extensive reports.
The second reason: InnerTrends offers a guided setup to ensure you can quickly and easily start using it without the help of data analysts and dev resources. It’s also laser-focused on B2B SaaS, using account-based analytics by default for all packages, including the free one.
Key features
Pre-built reports: provides ready-to-use analytics reports designed by growth experts and data scientists
Customer journey mapping: offers a framework to define and analyze customer journey metrics step-by-step
Data science algorithms: uses advanced algorithms to reveal optimization and growth opportunities automatically
Guided setup: ensures correct product analytics setup with expert guidance and a tracking plan
Engagement reports: provides insights into high, low, or no engagement accounts and their correlation with churn
Position decay attribution model: combines the best features of linear and time decay models for traffic source analysis
Integrations
InnerTrends connects with popular platforms like Google Analytics, Salesforce, Slack, HubSpot, and Mixpanel. It supports integrations with CRMs, email automation tools, payment platforms, and customer data platforms for a complete ecosystem.
Pricing
InnerTrends offers a free Core plan, a Startup plan at $79/month, a Growth plan at $299/month, and a custom-priced Scale plan for larger enterprises. Each plan includes a 14-day free trial to suit different business needs.
Rating
G2 rating: 4.7 / 5 stars, based on 12 reviews
"InnerTrends has been a game-changer, enabling us to gain deeper insights into our customers with an intuitive and user-friendly interface," says Jagan R., Small-Business User.
Harsh P., Head of Digital Marketing, shares the same enthusiasm: "InnerTrends provides actionable insights from a single place, making data analysis easy without the need for a Data Scientist."
6. Google Analytics: Best for web data tracking

Ah, Google Analytics, the trusty old friend! It's been the go-to for web data since the dawn of time (or at least it feels that way). Google Analytics captures detailed information about site visitors, including demographics, behavior patterns, and conversion data.
One of Google Analytics' greatest strengths is its ability to provide a holistic view of the customer journey. It tracks users across multiple devices and touchpoints, offering a complete picture of how visitors interact with your brand online.
Key features
Event-based data model: tracks user interactions as events, providing a more flexible and detailed analysis of user behavior
Cross-platform measurement: measures traffic and engagement across both web and mobile apps within a single property
Predictive metrics: uses machine learning to forecast user behaviors and outcomes, like potential revenue and churn probability
Privacy controls: includes features like cookieless measurement and data anonymization to comply with privacy regulations
BigQuery integration: Allows for advanced data analysis by exporting GA4 data to Google BigQuery
AI-powered insights: automatically surfaces significant trends and anomalies in your data using artificial intelligence
Integrations
Popular integrations include Salesforce, Microsoft Dynamics 365, Mindbody, Salesforce Pardot, and HubSpot.
How Google Analytics integrates with Chameleon
The Google Analytics and Chameleon integration highlights user behavior within your app. Here’s how:
Chameleon tracks user interactions with tours, messages, and more. It then seamlessly sends that data to Google Analytics for deeper analysis.
See the bigger picture. This integration lets you view Chameleon data alongside other website and app data within Google Analytics.
Pricing
Google Analytics 4 (GA4) is free for most users and suitable for small-to-medium-sized businesses. While the current price of Google Analytics 360 (GA360) is not publicly available, it was previously reported at $50,000 annually.
Rating
G2 rating: 4.7 / 5 stars, based on 6,364 reviews
"Google Analytics makes data collection easy for websites and social media, aiding in informed decision-making," shares Richard C., a Digital Consultant.
7. Snowplow Analytics: Best for event data collection

Snowplow Analytics is perfect for collecting event data on user behavior. Like many of these great platforms, Snowplow effectively centralizes all of your data rather than gathering it from the multiple applications that you use.
Data is available to view in real-time, so product teams can never miss a beat.
Every web event comes with a standard of 130 data points, such as information on the device, links, clicks, and referrals. Don’t feel overwhelmed with all the data; you can easily filter it down to the specific points you’re looking for.
Key features
35+ Trackers & webhooks: supports a wide range of trackers and webhooks for comprehensive data collection
1st party tracking: enables first-party data collection to ensure data ownership and privacy compliance
Real-time data streams: provides real-time data streaming capabilities via Kinesis, PubSub, and Kafka
Warehouse/lake destinations: integrates with major data warehouses and lakes like Snowflake, Redshift, BigQuery, and Databricks
Advanced enrichments: offers advanced data enrichments, including PII anonymization and custom JavaScript enrichments
Data quality monitoring: monitors data quality to ensure accurate and reliable data collection
Integrations
Snowplow Analytics connects with AWS services like Kinesis and SQS, Google Cloud's PubSub, Apache Kafka, and Azure Event Hubs. Snowplow can also send data to Google Tag Manager and supports custom integrations via HTTP.
Pricing
Snowplow Analytics offers two pricing options: a free, open-source version and a managed service called Snowplow BDP (Behavioral Data Platform). While pricing details aren't publicly available, the AWS Marketplace lists a guide price of $37,500 per year for Snowplow BDP Enterprise. This price can vary based on event volume, service level agreements (SLAs), and support needs.
Rating
G2 rating: 4.6 / 5 stars, based on 31 reviews
"Snowplow was a game changer in our understanding of customer behavior," says Robin P., Senior Data Warehouse Architect. "The granular data and autonomy to use it as needed give us complete freedom to build tailored products. Their customer service is top-notch, always available to help solve challenges."
8. Tray.io: Best for integrations and automation

Tray.io can seamlessly integrate with the rest of your cloud stack to automate complex workflows, ensuring consistent data streams for your product teams to analyze. This is a platform that prides itself on flexibility.
The intuitive drag-and-drop interface makes it easy for technical and non-technical users to build and manage integrations. The platform supports a wide range of applications, ensuring seamless data flow across systems.
Key features
Drag-and-drop workflow builder: allows users to create and manage workflows with an intuitive drag-and-drop interface
Pre-built connectors: offers hundreds of pre-built connectors for popular services like Salesforce, HubSpot, and Slack, enabling seamless integrations
API management: provides tools to manage, govern, and secure APIs, turning workflows into API endpoints
Real-time triggers: supports various triggers, including real-time, webhook, and scheduled triggers, to initiate workflows based on specific events
Data enrichment and transformation: includes core and helper connectors for data processing and manipulation within workflows
Custom connector development: allows users to build custom connectors using the Connector Development Kit (CDK) for bespoke integration needs
Integrations
Tray.io integrates with various applications, including Salesforce, Slack, and Shopify, enabling seamless workflow automation. Its full API access allows for robust connections across various platforms.
Pricing
Tray.io's services start at $2,500 per month with access to their automation and integration platform.
Rating
G2 rating: 4.5 / 5 stars, based on 153 reviews
Jithu V. says, "Tray.io makes us more dynamic! It maximizes APIs and enhances core product adaptability without extensive dev work."
9. Iterable: Best for automatic data capture and analysis

Iterable is a growth marketing platform enabling cross-channel customer engagement. It uses a simple drag-and-drop interface, helping you build systems that track the unique characteristics of your customers.
Whilst this software-as-a-service isn’t specifically aimed at product managers, the growth-driven systems will prove invaluable to your product team. The platform’s user-friendly interface helps to make data collection a lot less intimidating.
Key features
AI-powered capabilities: uses AI for predictive goals, generative AI, and AI-driven optimization to enhance marketing strategies
Real-time behavioral data: ingests and activates customer data in real-time to drive effective customer engagement
Cross-channel communication: connects with customers across mobile, email, SMS, and web, ensuring a unified customer experience
Drag-and-drop workflow builder: allows marketers to design full lifecycle journeys and personalized communications with an intuitive drag-and-drop interface
Extensive integrations: supports over 100 partner integrations, making it easy to fit into existing tech stacks
Experimentation tools: provides tools for A/B testing and optimizing send times and channels at the user level
Integrations
Popular integration platforms include Salesforce, Google Sheets, HubSpot, and Typeform.
Pricing
Although Iterable's pricing is not readily available on its website, according to review sites, the entry-level pricing for its services starts at $500 per month.
Rating
G2 rating: 4.6 / 5 stars, based on 587 reviews
Ty P. says, "Iterable is incredibly user-friendly and has excellent support. The platform is easy to use and provides powerful marketing capabilities."
10. Segment: Best for simplified data collection

Segment simplifies data collection with a single API that can collect event data from mobile apps, websites, and servers. This software takes away the hundreds of developer hours needed to build and maintain integrations, linking all your data.
Segment's scale is impressive. Browsing through its catalog, you can find hundreds of applications that you can integrate into this single, centralized stream of data collection.
With Segment, ‘Personas’ can be created from your consumer data. In other words, product teams can view comprehensive user history profiles to gain insight into common in-app traits, which can be utilized to build better user experiences.
Key features
Connections: collects event data from various sources like mobile apps, websites, servers, and SaaS applications and federates it to downstream tools
Protocols: governs data collection and storage, ensuring data is aligned with business objectives and compliance standards
Unify: creates actionable customer profiles by stitching together multiple touchpoints using identity resolution
Twilio engage: enables audience building and customer engagement through customizable audiences and direct communication channels like email and SMS
Real-time data processing: provides real-time data streaming and processing capabilities for immediate insights and actions
Integrations
Browsing through their catalog, you will see hundreds of applications you can integrate into this single, centralized data collection stream. Segment even integrates with Chameleon so that you can pipe data into Chameleon for precise targeting, and get data back out too. PS. If you install Chameleon through Segment, we’ll be up and running in a few clicks.
Pricing
Segment offers a Free plan with 1,000 visitors/month, two sources, 450+ integrations, and one data warehouse destination. The Team plan starts at $120/month and includes 10,000 visitors/month, unlimited sources, and public API access.
Rating
G2 rating: 4.5 / 5 stars, based on 550 reviews
George O. says, "I like the way it integrates with any other analytics and marketing tools and seemingly collects and passes on the full customer data. I was also impressed by the price and ease of implementation."
11. Zapier: Best for automation

Zapier has the ability to integrate all of your web apps and then automate workflows between them, ensuring that everything is working in harmony.
For product managers, setting routinely automated tasks can help their team stay focused on the important work that matters. With an extensive library of apps that can be integrated into Zapier, this platform enables you to transfer data from one app to another with automated workflows.
Rather than scrambling various sets of data together, with Zapier, you can create automated processes that will send product analytics data across multiple web apps when you need it to. This makes it easy for product management teams to refer to up-to-date and relevant analytics data.
Key features
Drag-and-drop workflow builder: create and manage automated workflows with an intuitive drag-and-drop interface
Paths: implement conditional logic in workflows to perform different actions based on if/then scenarios
Filters: ensure workflows run only when specific conditions are met, adding precision to automation
Formatter: transform data formats, such as dates, currency, and text, to fit your needs within workflows
Webhooks: send and receive data from any service without writing code, enabling advanced integrations
Schedule: automate tasks to run at specific times or intervals, ensuring timely execution of workflows
Integrations
Zapier integrates with popular apps like Google Sheets, Slack, Trello, and Salesforce, allowing seamless automation of workflows.
How Zapier integrates with Chameleon
Zapier connects Chameleon to your other apps, making life easier by automating tasks. Here's how it works:
Send Chameleon data: actions like survey completions or button clicks in Chameleon can be automatically sent to other apps (e.g., email tool) using Zapier.
Receive data: personalize your Chameleon tours! Zapier can bring in user information from other connected apps for a more tailored experience.
Pricing
Zapier offers a Free plan for basic workflows, and paid plans start at $19.99/month for advanced features. Team plans begin at $69/month, and Enterprise pricing is available on request.
Rating
G2 rating: 4.5 / 5 stars, based on 1,277 reviews
Kim B., Head of Product, says, "Zapier has allowed us to scale our business at a fraction of the cost. It's incredibly easy to use and implement, helping us set up processes within minutes instead of weeks."
12. Fullstory: Best for digital intelligence

FullStory is a digital intelligence platform, enabling product managers to track an extensive range of metrics to learn more about the experiences of users and how they interact with your product.
Upon connecting FullStory to your product, it can calculate potential opportunities to enhance your user experience, displaying specific user sessions that it suggests you should take action on to improve. This kind of clear, actionable data can help product managers make strategic and focused decisions on advancing their product’s development.
Key features
Session replay: visualize exactly how users interact with your website by replaying their sessions, including clicks, mouse movements, and page transitions
Heatmaps: generate visual representations of aggregated user interactions to identify areas of high engagement or potential issues on specific pages
Error tracking: capture and report errors encountered by users, allowing for prompt identification and resolution of technical issues
Conversion funnels: track and analyze user behavior at each stage of the customer journey to identify areas for improvement and optimize conversion rates
Defined events: create custom events with memorable names to easily track and analyze specific user interactions across your product
Metric alerts: automatically notify users when key metrics hit pre-set thresholds or experience abnormal shifts, enabling swift responses to problems and opportunities
Integrations
FullStory integrates with over 100 platforms, including Google Analytics, Chameleon, Slack, and Segment, for real-time insights and streamlined workflows across your tech stack.
How Fullstory integrates with Chameleon
While FullStory unlocks user behavior insights, Chameleon lets you take action on those insights! Here's the magic:
FullStory reveals user behavior: see how users interact with your product, including areas where they might be struggling
Chameleon personalizes the experience: use FullStory data to target specific user segments with Chameleon's in-app tours, messages, and surveys
Watch it happen: Chameleon experiences appear in FullStory recording so you can see how users actually engage with your in-app UX
Use Fullstory and Chameleon together to fight rage clicking on the spot. Use this “Recipe” to set it up.
Pricing
FullStory's pricing is not shown on its website. However, based on various Twitter/X threads, the cost ranges from $300 to $1,000 per month, depending on the number of seats, sessions, and months of data retention.
Rating
G2 rating: 4.5 / 5 stars, based on 759 reviews
Kayla G. says, "Fullstory is great for actually seeing what a user does instead of just having them write in a support ticket. I love that it records the user session and you can configure it to send along the session when you report a bug."
13. Hotjar by Conetentsquare: Best for visual data collection

Hotjar can collect visual data on how users interact with your product, using heatmaps and screen recordings to illustrate on-screen behavior.
Hotjar’s heatmaps display visual data on where users have been on your product the most, from how far they typically scroll down a page to where they frequently click. This can help product teams see how users interact with the interface and consider what affects their in-product decision-making.
You cannot get more accurate insights into a user’s in-product actions than a screen recording! Yes, using Hotjar’s screen recording plugin, every mouse movement and scroll will be tracked and logged. Product teams can watch these recordings in real time to understand how users interact with their product.
Key features
Heatmaps: visualize where users click, move, and scroll on your website to identify areas of high engagement and potential issues
Session recordings: watch recordings of real user sessions to see how they interact with your site and identify usability issues
Feedback widgets: collect real-time feedback from users directly on your website to understand their thoughts and feelings
Surveys: create and deploy surveys to gather in-depth user insights and feedback on their experience
Engage (user interviews): conduct live user interviews to gather qualitative insights and understand user needs and expectations
Conversion funnels: track user progression through key steps on your site to identify where users drop off and optimize conversion rates
Integrations
Hotjar integrates with popular tools like Google Analytics, Slack, HubSpot, and Optimizely, improving its ability to provide insights and workflows for users.
Pricing
Hotjar offers a Basic Plan for free with limited features and the paid plans start from $59 per month.
Rating
G2 rating: 4.3 / 5 stars, based on 304 reviews
Usha B. says, "Hotjar has everything needed to analyze visitors' activity and customize our website accordingly. It's easy to integrate with any CMS and their customer support is very supportive."
14. Pendo: Best product experience platform

Pendo is a product experience platform designed to help software companies understand and guide their users. It integrates with web and mobile applications to collect data on user behavior, enabling businesses to track feature adoption and user engagement.
Pendo provides in-app messaging, surveys, and walkthroughs to enhance user onboarding and ongoing engagement. Product managers and teams can create and deliver targeted messages without coding skills.
Key features
Guide layouts: Customizable templates for creating in-app guides like lightboxes, banners, and tooltips
Flow triggers: Options to activate onboarding flows based on user actions, device types, or segments
Localization settings: Ability to stop guides from triggering if not translated into the user's language
Product analytics: Native analytics provide insights into user behavior and feature usage patterns
Feature engagement tracking: Dashboard widgets to view feature engagement from multiple perspectives
Feedback collection: Tools to gather user feedback through polls, input fields, and NPS surveys
Paths and funnels: Visualization of user journeys and conversion paths through the product
Integrations
Pendo integrates with popular tools like Salesforce, Slack, and Segment, allowing you to collect and analyze user data across platforms.
Pricing
While Pendo doesn't publicly list their pricing, a Reddit user shared that as of February 2024, Pendo’s plans start at approximately $2k per quarter for 2k Monthly Active Users (MAU).
H4: Rating
G2 rating: 4.4 / 5 stars, based on 1,423 reviews
Janaya F. says, "I've used Pendo for years and brought it to every company I've worked at. It's easy to use, captures data immediately, and integrates with other software seamlessly. I spend hours daily on Pendo reviewing analytics and creating guides for customers."
15. LogRocket: Best for front-end application monitoring

LogRocket is a front-end application monitoring solution that helps developers understand their users' experiences. It captures everything users do in a web application, providing session replays, performance monitoring, and error tracking.
It also provides insights into user behavior, helping teams to improve the overall user experience. With features like network activity tracking, console logs, and heatmaps, LogRocket offers a comprehensive view of how an application performs in the real world.
Key features
Session replay: reproduce every user session with a pixel-perfect replay to see DOM state, network logs, JavaScript errors, and performance data for in-depth debugging
Heatmaps: visualize user interactions such as clicks, mouse movements, and scrolls to identify areas of high engagement and potential issues
Error tracking and issue management: monitor JavaScript errors, network failures, and performance issues, and review stack traces alongside video replays of every issue
Frontend performance monitoring: correlate frontend performance metrics like page load times, CPU/memory usage, and browser crashes with business impact
Product analytics: track custom metrics, funnel conversions, user flows, and event volumes to convert, engage, and retain customers
User experience analytics: use heatmaps, click maps, and scroll maps to optimize page layouts and quantify user frustrations like rage clicks and dead clicks
Integrations
LogRocket integrates seamlessly with tools like Slack, Jira, and GitHub, streamlining bug tracking and collaboration.
Pricing
LogRocket's paid plans start at $99/month, offering features like pixel-perfect session replay, JavaScript error reporting, and detailed product analytics. A free plan with 1,000 sessions per month is also available.
Rating
G2 rating: 4.6 / 5 stars, based on 1,512 reviews
Chelsea C. says, "LogRocket is simple and effective! It's easily and quickly accessible, assisting with predicting customers' inquiries and resolving them before they provide details."
How to choose the right product analytics tool for your team
Subscription fatigue got you down, but still craving that sweet, sweet user data? Don't worry; we’re not leaving you to browse endless SaaS marketplaces! Here are a few factors for finding the best product analytics tool:
Identify your needs: before diving into tools, define your goals. Are you looking to understand user behavior, optimize conversion rates, track feature usage, or a combination? Knowing your priorities will help narrow down options.
Consider features & functionality: different tools offer various features like session replays, heatmaps, user surveys, and funnel analysis. Make a list of features crucial to your goals.
Ease of use: is your team tech-savvy? Choose a tool with a user-friendly interface and clear instructions. Don't get bogged down by complex setups that slow down adoption.
Data integration: does your tool integrate with other platforms you use? Seamless data integration with existing CRM or marketing tools saves time and provides a holistic view of user data.
Scalability: consider your future needs. Will the tool accommodate your user base as it grows? Choose a tool that scales with your app to avoid costly upgrades down the line.
Pricing: set a realistic budget. Many tools offer tiered pricing based on features and data volume. Analyze costs versus the value they provide.
Free trials & demos: most tools offer free trials and demos. Take advantage of these to test functionalities and see if the user interface is a good fit for your team.
🤯Evaluating and buying software is tough work—that’s why we wrote the Digital Adoption Platform Buyer’s Guide. It comes with evaluation matrixes and business plans to help you make the best software decisions.
PS. We cover product adoption tooling in the guide, we think you’ll love it. Check it out here.
Understand users and track performance with the best product analytics tool
When it comes to choosing product analytics tools and platforms, you are simply spoilt for choice! There are so many to choose from. It’s certainly a crowded market.
That's why we hope that our insights have helped you make a better-informed decision. As we have discussed, some of these platforms and tools will be more useful to your product team than others, depending on your needs, goals, and your overall product vision.
Ultimately, it’s about picking what works for you. In many cases, you may decide to use several of these tools and platforms at once. This will enable your team to capture a wide net of useful data and drive your product to success.

Weekly advice to make your product stick 💌
Be the first to get the latest product best practices and resources

