


You’ve put time and effort into building in-product experiences—but are they actually delivering results? Are your users finding value and sticking around, or are they hitting roadblocks?
Success depends on tracking the right metrics. Whether it’s adoption, retention, or churn, the numbers tell a story about how users interact with your product. But that’s not all. You also need to understand what drives them. Are users navigating features easily? Do they face friction when getting started?
Every product and user is unique, which means your approach needs to fit your goals. In this article, we’ll show you how to track the product success metrics that matter and turn insights into better in-product experiences.
What are product success metrics?
Product success metrics are the numbers that show how well your product is doing. They help you understand what’s working, what’s not, and where to go next.
For example, metrics like user adoption rate, retention rate, and churn rate help evaluate how effectively a product engages and retains users. Others, like customer satisfaction (CSAT) or Net Promoter Score® (NPS), measure user satisfaction, sentiment, and loyalty.
Why product success metrics matter
Product success metrics keep you on track and ensure every move brings value. Here's why they’re essential:
They keep decisions grounded in data. Metrics give you facts. Instead of relying on gut instinct, you can confidently tweak features, prioritize updates, or make bold pivots based on what the numbers tell you.
They uncover what’s working—and what’s not. Is user onboarding smooth, or are people dropping off halfway? Are users loving your new feature, or does it need adjustments? Metrics spotlight areas to celebrate and areas to improve.
They align your team with business goals. Product success is about happy users and meeting revenue, retention, and growth targets. Metrics bridge the gap between user experience and business objectives, so everyone’s rowing in the same direction.
They boost user engagement and retention. When you understand how users interact with your product, you can design experiences that keep them coming back. Metrics show what drives value and where friction might be pushing users away.
They measure success—and pave the way for more. Success is about growing with your users. Metrics let you track progress, prove ROI, and continuously refine your product.
Now, how do we make sense of all these metrics? Created by ProductPlan, the SaaS Product Metrics Pyramid is a way to structure and prioritize your product metrics. It guides you from the big-picture North Star Metric at the top all the way down to the granular day-to-day indicators at the bottom.

Top (North Star Metric): This is the most important metric that directly aligns with your product's ultimate goal (e.g., user adoption, revenue). It represents the “big picture” goal.
Middle (Key Influencers): These are 2–3 key metrics that influence the North Star Metric. They are tied to current initiatives or features you're working on, like feature adoption or customer satisfaction.
Bottom (Levers): These are the granular, day-to-day metrics that measure common performance indicators that contribute to the bigger picture. They could be things like daily active users or specific feature interactions.
Now that we understand why tracking the right metrics is crucial, let’s dive into the top seven product success metrics you should track to drive meaningful results.
7 Key product success metrics to track
To truly measure your product's impact, you need to focus on the metrics that matter most. Here are seven key metrics that will give you the insights you need to drive growth, engagement, and long-term success.
1 . User adoption rate

User adoption rate tracks how many new users begin using your product or a specific feature within a given time period.
For example, let’s say you launch a new feature in your app. Over the first month, 150 new users out of 1,000 active users engage with the new feature. Here’s how you calculate the adoption rate:
User Adoption Rate = (150/1000)×100 = 15%
This means that 15% of your active users have started using your new tool. While this gives you an initial idea of engagement, it’s important to consider whether this rate aligns with your expectations for the feature’s rollout. If 15% adoption is within your target range (say you expected 10–20%), then it’s a good start.
However, if you were aiming for 40% adoption, this could indicate that additional efforts are needed—improving the feature’s visibility, simplifying its onboarding process, or gathering user feedback on what’s holding them back.
What’s a good user adoption rate?
According to Userpilot’s Product Metrics Benchmark Report, product-led companies had a core feature adoption rate of 24.3% in 2024.

(Source)
2. Activation rate

Activation rate measures the percentage of users who take a predefined action (a user activation event) that indicates they’ve moved from just signing up to actively using your product.
For example, an activation event could be a user completing their profile, uploading a first document, or making their first purchase. These events are tailored to your product and represent moments where users experience the core value that will keep them engaged.
🚩 If users aren’t completing activation events, it’s a red flag that they’re not seeing value in your product and are unlikely to stick around.
When should you measure activation rate?
During initial user sign-ups
After a product update or new feature release
Following marketing campaigns or promotions
When introducing a major product improvement
What’s a good activation rate?
According to the same Product Metrics Benchmark Report 2024, activation rates vary by product complexity:
Simple SaaS tools (e.g., task management) often see activation rates above 80%
Complex products (e.g., enterprise SaaS or analytics platforms) tend to have lower rates, around 40–60%
How to boost your SaaS activation rate
Here are a few ideas on how you can boost your activation rate:
Carefully design user journey maps
Get user feedback through microsurveys
Analyze behavior analytics and user cohorts
Optimize your user onboarding to shorten the time it takes for new users to activate
3. Retention rate

Retention rate is the percentage of users who keep coming back to your product after their first interaction. It's the “stickiness” of your product. The higher the retention, the more likely your users are to find consistent value and are here to stay—rather than just checking your product out once and then ghosting you.
There are a few different metrics that can measure customer retention, with retention rate being just one among them. Other customer retention metrics include churn rate, average customer lifetime value (CLV), repeat purchase rate, and Net Promoter Score® (NPS).
How to boost your retention rate?
Show users around new features with product tours so they don’t miss out on the cool stuff. In Chameleon's Benchmark Report, for example, we found that 3-step product tours have an average 72% completion rate—the highest amongst tours of other lengths.

Download the In-Product Experiences Benchmark Report
Improve your in-app messaging and scale self-serve success with data and insights from 300 million user interactions with Chameleon Experiences. We'll send the Report to your inbox!
4. Churn rate

Churn is a SaaS company's worst nightmare. High churn can have a massive impact on revenue and rapidly stagger growth.
Churn rate:
Reflects how well a product retains its users, which is often more cost-effective than acquiring new customers
Directly affects revenue, customer lifetime value, and customer acquisition costs
Is essential for accurately predicting future growth rates and revenue
To fight churn and make sure users stick around, interact with users directly within your product to provide guidance when they hit a blocker, gather their feedback, nudge them towards key actions, and offer easy access to support resources.
5. Customer lifetime value (CLV)

Customer lifetime value (CLV) is the total revenue a customer is expected to generate for your business throughout their entire relationship with your product. It’s a big-picture metric that helps you understand how much a customer is worth, factoring in not just subscription fees but also renewals, upgrades, and referrals.
If your customer acquisition cost (CAC) exceeds your CLV, you’re losing money with every customer you bring in. On the other hand, a higher CLV compared to CAC means you’re building a profitable business. CLV also helps you:
Identify your most valuable customers, so you can focus on retaining and nurturing them
Set realistic marketing budgets by understanding how much you can afford to spend on acquiring new users
Improve customer retention strategies by tracking how changes in engagement impact lifetime revenue
Drive long-term growth by maximizing the value each user brings to your product
What’s a good CLV or LTV?
There’s no universal "good" CLV—also known as lifetime value (LTV)—it depends on your business model, industry, and growth strategy. However, companies typically aim for an LTV to CAC ratio of 3:1 or higher. This means the average revenue per customer over their lifetime in your product should ideally be three times the cost of acquiring them.
How to increase your LTV
Build add-on value into your product: Focus both on increasing revenue and retention.
Expand your product line to attract new customers but also add cross-selling opportunities to current user plans.
Encourage customers to sign up for a discounted annual subscription instead of a monthly one.
Master scalable pricing: Offer cheaper and more expensive alternatives depending on the solvency and loyalty of customers (don’t forget to segment and get feedback from your customer base).
6. Net Promoter Score® (NPS)
Net Promoter Score® (NPS) measures customer loyalty and customer satisfaction score together. It’s based on a single question:
"How likely are you to recommend this product to a friend or colleague?"
Respondents rate their likelihood on a scale of 0 to 10, and based on their response, they’re categorized into three groups:
Promoters (9–10): Loyal customers who actively recommend your product
Passives (7–8): Satisfied but not enthusiastic, and less likely to spread the word
Detractors (0–6): Unhappy customers who may discourage others from using your product
The NPS Formula
To calculate your NPS, subtract the percentage of Detractors from the percentage of Promoters:

The score ranges from -100 to +100, with higher scores indicating stronger customer loyalty.
What makes Microsurveys so effective for NPS?
Chameleon’s Microsurveys are a game-changer for collecting NPS data. Microsurveys are short, in-app surveys triggered by specific user actions (or inactions). For example, you can deploy an NPS Microsurvey after a user has completed onboarding or achieved a key milestone in your product.
Delivered in-app, they appear at the right moment without disrupting the user’s flow
With a single "one-punch" question, users are more likely to respond
You can use them for more than just NPS—think onboarding segmentation, beta opt-ins, or even cancellation deflection
Our Benchmark Report reveals fascinating trends in Microsurveys and their performance:
Over the last four years, Microsurvey completion rates averaged 20%. However, this year saw a dip to 15%, prompting further analysis.
While NPS Microsurveys have traditionally performed well, this year, multi-button surveys led with a 27.2% completion rate, compared to NPS’s 10%.
Microsurveys with three options consistently achieved the best completion rates (40.2%). Adding more than three buttons caused response rates to decline.

Deploy better surveys faster
The best place to collect user feedback is in context
7. Feature usage metrics

Feature usage metrics tell you how users interact with specific features in your product. While activation rate measures whether users reach a key milestone for initial engagement, feature usage metrics dig deeper into the ongoing interaction with individual features. These metrics help answer questions like:
Which features are most (and least) used?
How often are users engaging with specific features?
Are there any features that users struggle to find or use effectively?
Key feature usage metrics to track include:
Adoption rate: The percentage of users who start using a feature. For example, if 1,000 users signed up and 400 used your dashboard, the adoption rate is 40%.
Engagement frequency: How often users return to a feature. For instance, do users log in weekly to generate reports, or do they rarely come back after the first use?
Time spent on feature: Measures how long users spend using a feature. This can signal whether they find it valuable or if they’re stuck trying to figure it out.
Task completion: Tracks whether users complete specific workflows tied to a feature, like creating a project or finishing onboarding.
Measure the success of in-product experiences in 3 steps
1. Find the adoption bug
🐛 The adoption bug is a negative event within the user journey that can cause friction, prevent users from performing key actions, fail the activation of important features, and eventually result in churn.
Regardless of your use case for implementing in-product experiences, what you're ultimately trying to achieve is most likely to get people to love and use your SaaS product. Product adoption – maintaining users active and interested in your product for a long time – is the goal of any product team.
With in-app messages, you are interacting with users when and where they need it the most inside your product. But to use them effectively (a.k.a. knowing what when and where mean), you must first identify which adoption pain they are targeting.
Finding the adoption bug will make your goal for implementing in-app messages very clear, and hence give you insight on which metrics to follow.
Let's say your team has observed that users who adopt X feature are more likely to upgrade to a higher plan, so you hypothesize that if you push more users to activate said feature, you will get more upgrades.
Here, you already have two metrics to look at: feature adoption and number of upgrades. But, in order to create a strategy that delivers those numbers, you need to find what might be preventing people from activating the feature in the first place - this is the adoption bug.
The strategy you come up with, will then tell you what other metrics you should care about. If you decide to implement a design change, you might want to get user feedback to evaluate it, if you're targeting a group of users with subtle in-app tours of the feature, you might want to check tour completion rates as well.
2. Define your key metrics
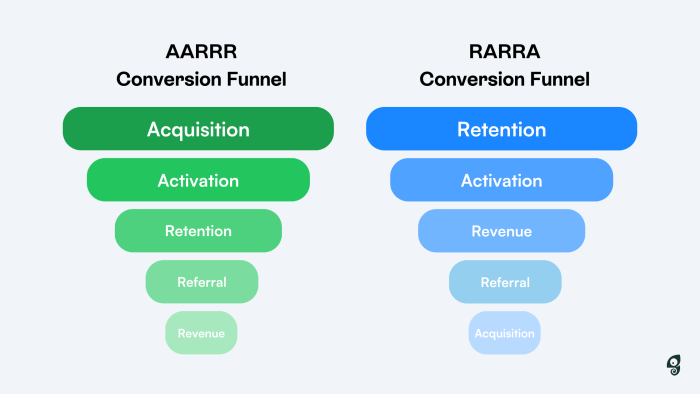
The typical SaaS conversion funnel follows either the AARRR or RRRAA frameworks (both stand for acquisition, activation, retention, referral, revenue) to define and assess how users are flowing through their journey from qualified leads to happy customers.
Regardless of how your funnel is stacked, each stage will rely on specific respective metrics to analyze how users are flowing through each phase and find areas for growth and improvement.
The metrics you should use to evaluate the success of your in-product experiences will vary depending on your use case, what your adoption bug is, and what KPIs you are using to measure product-led growth.
The best way to make sure that your assessment paints a true picture of how well in-product experiences are performing is to make it twofold: from one end you will measure the results of your in-app messaging strategy, and on the other end you will assess how well the product you're using to build these messages in performing.
Looking at numbers relating to how well the experiences you're creating are performing in terms of engagement, completion, and response rates, positive user evaluation, and how they navigate from one experience to another, can help you assess how well your messaging is positioned. This will help you understand whether you're targeting the right users, and even if the product you're using to create them satisfies your needs.
On the Chameleon Dashboard, for example, you can visualize data on how many times experiences are being viewed, opened, started and completed over time.
3. Experiment
Experimentation can be a powerful ally to creating successful in-product messaging strategies. You can, for example, test which UX flow is most likely to get users to engage - is it through attractive modals, or through discreet Tooltips?
Reasons to experiment
- Determine best practices
- Find the right messaging style
- Figure out what works for each audience
- Find the adoption bug
- Validate your assumptions
A/B testing
To experiment with in-app experiences and identify the best practices that will get you the results you need, you can define testing user groups and target them with a different experience to assess which one has the impact you're looking for.
In order to conduct an A/B test, you must be able to segment users into cohorts and control what experiences they're targeted with and when.
Learn how you can leverage Chameleon's audience segmentation filters and integrations with product analytics tools to test your in-app experiments amongst controlled or specific test groups.
Regression analysis
Regression analysis helps you understand how different factors impact your product's success. If you want to know how things like new features, marketing efforts, or customer behaviors affect key metrics—like user retention, sales, or engagement—regression analysis can help you figure that out.
For example, let's run an analysis in which the goal is to determine whether the activation of a particular feature can impact overall user retention rates.
Before running this analysis, we’ve already hypothesized from our product usage data that users who have activated a feature from a targeted in-app message had higher retention than other users.
Hypothesis: Users who activate X feature have higher retention rates, hence increasing the activation of X feature will increase overall customer retention.
To test this hypothesis, we will measure the metric that is being impacted - in this case, user retention - against what might be causing the impact.
Dependent variable (what is being impacted): Customer retention rate
Independent variable (what can be causing the impact): Feature X activation rate
You’ll then need to establish a comprehensive dataset to work with, which you can do by administering surveys to your audiences of interest. Using Chameleon Microsurveys, for example, you can ask questions relating to the independent variable:
Are you interested in this feature?
Did you know we offer it?
Would you like to try it?
Would you recommend it to others?
The answers to these questions will begin to shed light on the relationship between the two variables you're testing: perhaps feature activation is low because users are not aware of it, or it simply doesn't bring them any value.
With these initial insights, you may begin developing experiments that aim to prove your hypothesis. For example, if you find that most users are interested in using the feature but don't know how to, you can offer them guidance with a tour.
To complete the regression analysis, you will need to plot the results of your experiment in a chart with your dependent variable on the x-axis and independent variables on the y-axis and assess whether they impact each other.
Regression analysis is a reliable method of identifying which variables have an impact on a topic of interest. The process of performing a regression allows you to confidently determine which factors matter most, which elements can be ignored, and how these influence one other.
Leverage metrics and Chameleon for product success
Tracking product success metrics helps you understand your users, identify opportunities, and drive meaningful growth. But metrics are only as powerful as the tools you use to act on them. With Chameleon, you can do more than just measure success—you can create it.
Whether it’s through in-app Microsurveys for real-time customer feedback, product tours that accelerate feature adoption, or tooltips that guide users to “aha” moments, Chameleon empowers you with everything you need to engage users, reduce friction, and drive growth.

In-App Marketing 101: Best Practices, Top Tools, and Examples

What is in-app messaging: a brief guide to benefits, types, and examples


