


If product management is about building the right thing, product analytics is how you know whether you actually did.
Product Analytics is how you move from “umm we think this feature works??” to “yes! this feature converts 18% of users to paid plans!” driven by quantitative data. Think of it as your product’s built-in truth serum.
TLDR? Product Analytics tells you:
Who your users are
How they’re using your product
Where they’re getting stuck
Key user interactions patterns
When they drop off or lean in
With product analytics, you can capture every micro-interaction of user behavior and illuminate the critical moments of friction, delight, and opportunity, and make your users happy and satisfied.
Okay but why is Product Analytics so important?
Let’s rewind. Back in the day, product managers had to rely on manual surveys, NPS scores, and customer data through interviews to understand user behavior. Valuable? Sure. But also slow, expensive, and often disconnected from real product usage.
Today, that’s changed. If you want to build a product that lasts, you need to start with one thing: clarity.
You can’t grow what you don’t understand. And product analytics exists to give you that understanding.
Patrick Collison, co-founder of Stripe, once asked a new PM a deceptively simple question: “Why are our customers churning? And how do they behave differently from the ones who stick around?”
That question is at the heart of what product analytics is designed to answer.
Because at the end of the day, your gut can only take you so far. Product analytics replaces hunches with hard data. It lets you track what real users do (and not just what they say), it helps you answer critical questions like:
Who are my most valuable customers?
What actions do they take that lead to retention or revenue?
What steps can I take to optimize the customer journey?
Which users are churning and why?
What do successful user interactions look like?
What are the behaviors of highly engaged vs. disengaged users?
This isn’t abstract theory. With the right data analytics setup, you can see in real time how customers are interacting with your product, which features are actually delivering value, and where users fall off.
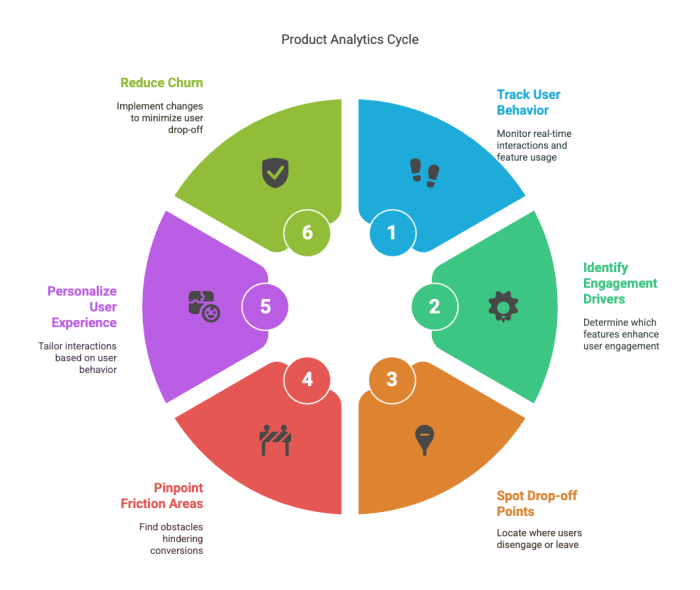
Instead of relying on customer interviews or educated guesses, product analytics helps you:
Identify which features drive engagement and which get ignored
Spot exactly where users drop off in their customer journey
Pinpoint the friction that’s killing conversions
Identify successful user behavior
Personalize experiences based on real behavior
Reduce churn by proactively fixing pain points
It’s how you make informed choices, measure success, and keep your team focused on what actually moves the needle.
In short: if you’re not using product analytics, you’re flying blind. And no one wants that - building a SaaS is hard as is.
What's the difference Between Product Analytics and Web Analytics
It’s easy to lump product analytics and web analytics into the same bucket - after all, they both deal with data and business intelligence, right? You'd think so but they're quite different. They’re built for completely different purposes, and if you’re using one when you need the other, you’re missing the point.
Web analytics (like Google Analytics) is focused on the top of the funnel. It helps you answer questions like:
How are people finding my site?
Which landing pages convert best?
What’s my bounce rate?
It’s primarily a marketing tool, great for tracking acquisition and turning visitors into customers.
Product analytics data on the other hand, shows you data after someone signs up. It’s all about what happens once they’re inside your product. Are they engaged? Confused? Retaining? Churning?
In short:
Web analytics data = how users arrive
Product analytics data = what users do once they’re in
Here’s another way to look at it: Web analytics tells you what brought them to the door. Product analytics tells you what makes them stay. Product managers will find product analytics data much more valuable and useful.
And there’s one more big difference - data ownership. Web analytics often relies on aggregated, sometimes third-party data. But product analytics is first-party where you’re tracking your own users, in your own product, which means the insights are deeper, more specific, and more actionable.
If your goal is long-term retention, product-led growth, and building features users love? Web analytics won’t cut it. Product analytics is where the real insight begins.
What Key Metrics should you track in Product Analytics?
Tracking the right metrics is the difference between making informed product decisions on how users engage or just guessing. Product analytics isn’t about drowning in dashboards but rather zeroing in on the user behaviors that matter most so you can build smarter, iterate faster, and grow sustainably.
Here are the key metrics every product team should obsess over (and why):

1. User Engagement
If you want to understand how sticky your product really is, start here. User engagement goes beyond clicks and pageviews, it’s about mapping the entire customer journey:
How did they find you?
What did they do before signing up?
Which features did they gravitate toward or ignore?
What keeps them coming back?
The goal is to pinpoint which interactions lead to value, so you can optimize those moments for more users. Instead of just counting visits, measure how users move from signup to activation to habit. That’s the kind of user behavior data that transforms onboarding, feature discovery, and retention.
2. Customer Churn
Churn isn’t just a number, it’s a signal. Tracking when and where users stop using your product helps you reverse-engineer their exit. Were they confused? Did a bug break their flow? Did they hit a dead end?
Product analytics shows you those drop-off moments in real time, so you’re not waiting for angry emails or survey responses to know something’s wrong. Spot the churn pattern, then fix the friction.
3. Retention
Retention is your product’s heartbeat. It shows how many users come back, when they return, and how often. With this data, you can:
See what actions high-retention users take
Identify which features build habit
Set time-based retention windows (Day 1, Day 7, Day 30) to track engagement over time
When you zero in on the type of user behavior that keeps your best users around, you can replicate that experience across the board, and spot where others are falling off before it’s too late.
4. Customer Acquisition Cost (CAC)
How much are you spending to acquire each customer? If CAC is rising, and product usage isn't following, it's a sign your onboarding or value prop may need work.
Product analytics lets you test whether product tweaks, like simplifying the signup flow or showcasing key features earlier, actually reduce CAC over time.
5. Customer Lifetime Value (LTV)
LTV is a window into your most successful users. Tracking this helps you spot patterns in behavior:
What features do high-LTV customers use the most?
What does their onboarding journey look like?
When do they convert from free to paid?
Once you understand the user behavior that drive long-term value, you can build targeted experiences that nudge more users toward the same path - boosting conversions, improving free trial performance, and strengthening retention.
What Should you look when choosing a Product Analytics Tool?
Not all product analytics tools are built the same. A basic tool might show you bounce rates and pageviews but that won’t cut it if you’re serious about product-led growth, retention, and user experience optimization.
An ideal product analytics software should be your source of truth that helps you see what users are doing, why they’re doing it, and how to make them do more of what you want.
Here’s what separates a good analytics software from a truly great one:
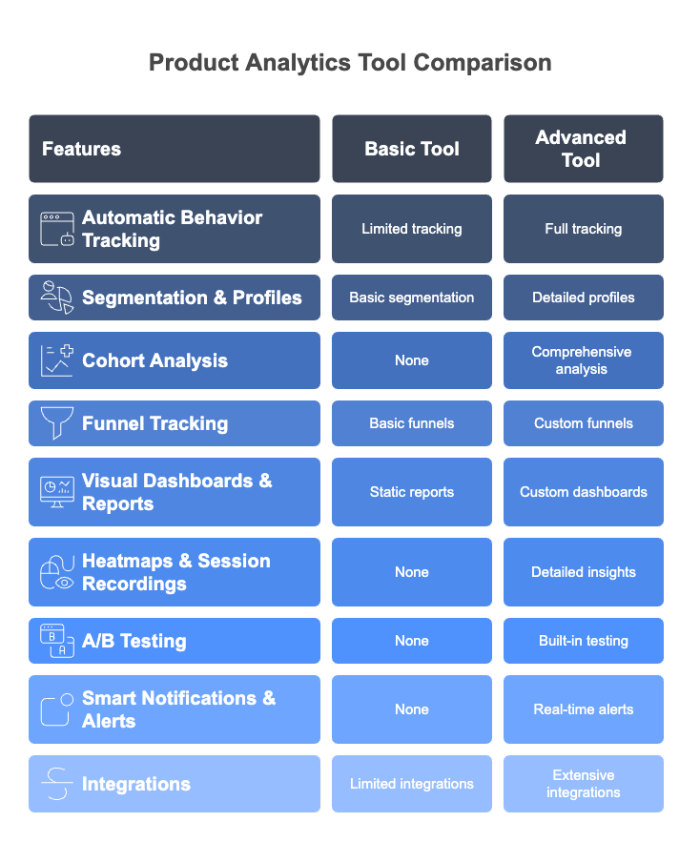
1. Automatic Behavior Tracking
Manually tagging every click? That’s a fast track to burnout. A solid product analytics tool lets you automatically track user interactions across your website and app, so you’re capturing everything from signups to feature usage without needing a developer every time.
2. Segmentation & Profiles
Knowing that “users clicked a button” is nice. Knowing which users, where they came from, what device they’re on, and whether they’ve been active in the last 30 days? That’s power.
Segmentation helps you slice users by behavior, location, signup source, and more.
Profiles let you create categories based on user attributes—like trial vs. paid, or new vs. power user so you can tailor experiences and messaging.
3. Cohort Analysis
Want to know what separates the customers who stick from the ones who bounce? That’s where cohort analysis shines.
Group users by shared experiences, say, people who signed up during your last launch and analyze how their behavior differs over time. You’ll gain insight into retention rates, lifetime value (LTV), and product engagement trends by cohort.
4. Funnel Tracking That Actually Matters
Funnels should tell a story, not just spit out numbers. A top-tier analytics tool allows you to build custom funnels that track key conversion paths from homepage visit to sign-up to feature activation and pinpoint where users are dropping off.
Now you’re not just seeing what’s broken - you’re fixing it.
5. Visual Dashboards & Custom Reports
Your data is only as good as your ability to communicate it. The best tools give you clean, customizable dashboards that make it easy to:
Monitor KPIs in real-time
Share insights across teams
Get buy-in from stakeholders
No more drowning in spreadsheets. Just clean, visual storytelling that drives action.
6. Heatmaps & Session Recordings
Numbers tell you what’s happening. Heatmaps and session recordings show you how it feels.
Heatmaps highlight hotspots where users click, scroll, or drop off.
Session recordings let you replay real user sessions to observe behavior, hesitation, and pain points.
It’s like doing hundreds of user interviews without booking a single call.
7. A/B Testing Built In
Testing isn’t optional if you want to improve. Great analytics tools let you run experiments on copy, features, flows, and designs, and compare performance side by side.
No guesswork, just cold, hard data collection telling you what works.
8. Smart Notifications & Alerts
You shouldn’t have to dig through dashboards to catch something important. Look for tools that offer real-time notifications so product teams can react quickly and even alert users based on behavior triggers (think nudges when users stall in onboarding).
9. Integrations with Your Stack
Your analytics solution should play nice with your other tools. Whether it’s your DXA tools, BI dashboards, CRMs, or marketing platforms, make sure it integrates easily so you can enrich analytics data and maintain workflow continuity.
Analytics in a silo = limited value. Analytics in your ecosystem = game changer.
Here are the Top Product Analytics Tools for you to choose from:
There’s no shortage of product analytics systems but choosing the right one can mean the difference between actionable insights and data overwhelm. Whether you’re just starting out or scaling fast, the best product analytics solution should help you track user behavior, understand friction, and optimize engagement without adding unnecessary complexity.
Here’s a rundown of the top product analytics tools on the market right now and what each one does best:
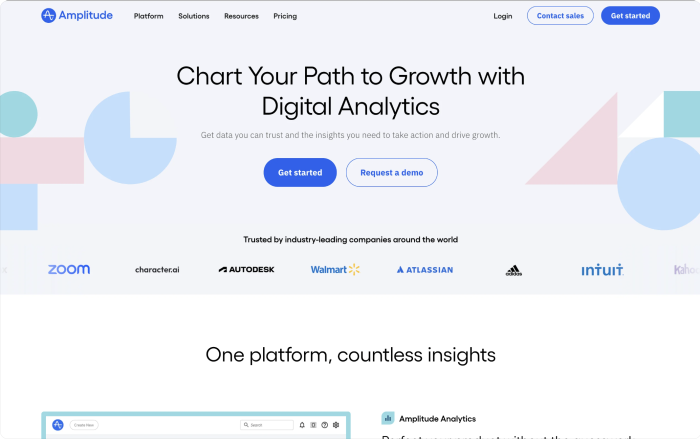
1. Amplitude
If you want to go deep on user journeys, Amplitude is your powerhouse. It’s built for product teams that need advanced behavioral analytics at scale, letting you break down complex user flows, segment users by behavior, and uncover what drives retention or churn.
Best for: In-depth behavioral insights and product-led growth teams.
Use case: Understanding feature adoption across cohorts, tracking long-term engagement.
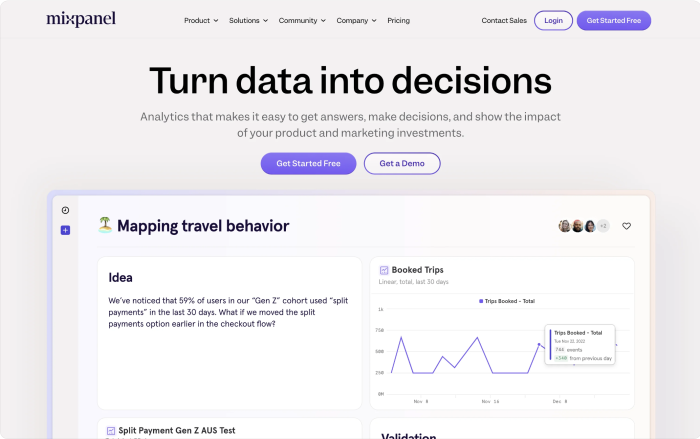
2. Mixpanel
Mixpanel is Amplitude’s slightly more accessible cousin. While not as heavy-duty in terms of modeling, it’s easier to use and quick to set up, with solid event tracking and funnel analysis.
Best for: Startups or smaller teams that want strong analytics without the learning curve.
Use case: Tracking conversion funnels, A/B testing, and segment-based insights.
3. PostHog
Open-source, flexible, and surprisingly robust, PostHog is the Swiss Army knife of product analytics. You get everything from event tracking and session replays to feature flags and heatmaps - all in one stack, and with full control over your data.
Best for: Teams that want transparency, customization, or self-hosted analytics.
Use case: End-to-end behavioral analysis with built-in privacy control.

4. Userpilot
More than just analytics, Userpilot helps you guide users through your product with in-app onboarding flows, tooltips, and event tracking. Great for boosting adoption without needing engineers.
Best for: Product teams focused on activation, onboarding, and user enablement.
Use case: Creating product tours, tracking feature usage, and improving new user experience.
5. June
If you’re a founder or early-stage product builder, June is perfect. It offers simple, clean event tracking without overwhelming you with complexity. Built for product-oriented teams who want signal, not noise.
Best for: Small teams and solo founders who want quick insights.
Use case: Tracking core events, monitoring user retention, sharing metrics with your team.
6. Hotjar
Hotjar isn’t a full-blown analytics platform but it’s an excellent companion tool. With heatmaps, session recordings, and feedback polls, it helps you understand how users feel about your product.
Best for: Supplementing traditional analytics with qualitative insights.
Use case: Discovering UI issues, watching user sessions, and gathering real-time feedback.

7. Usermaven
Affordable, lightweight, and refreshingly easy to use, Usermaven is great for teams that want basic analytics without the bloat. It’s a solid option if you’re early-stage or budget-conscious.
Best for: Startups and small businesses looking for quick setup and clean dashboards.
Use case: Monitoring site and product metrics, without needing a data team.

8. Heap
Heap automatically tracks everything clicks, taps, swipes, without requiring manual event setup. That means you can go back and retroactively analyze interactions you didn’t know you needed.
Best for: Teams who don’t want to tag every single event manually.
Use case: Discovering hidden user behaviors and building reports fast.
9. UXCam
If you're building for mobile, UXCam is a must-have. It provides session replays, heatmaps, and frustration signals, helping mobile teams understand how users interact with apps—and where they’re struggling.
Best for: Mobile product teams that care about in-app experience.
Use case: Improving UX through session analysis and behavioral triggers.

So how do you go about Choosing the Right Product Analytics Tool?
Honestly, the best tool depends on your team size, tech stack, and analytics maturity.
Need depth? Go with Amplitude or PostHog.
Want ease? Try Mixpanel or Usermaven.
Focused on onboarding? Userpilot might be your best bet.
On a budget but still want insights? June + Hotjar is a killer combo.
Whatever you choose, make sure your product analytics tool:
Tracks behavior automatically
Helps you understand user journeys
Supports cohort and funnel analysis
Integrates with the rest of your stack
A good product is built on great instincts. A great product is built on great data. And these product analytics solutions will help you get there.
How do you Implement Product Analytics at Your Company?
So you’ve decided to invest in product analytics! Great call! But before you start tracking every click and session, stop. The worst mistake you can make is diving in without knowing what you’re looking for.
The secret to great analytics isn’t more data, it’s more purposeful data that leads to data driven decisions . Here’s how to implement product analytics that actually moves the needle for your business.
1. Start With the End in Mind
Don’t collect data just to have it. Start by asking: What business outcomes are we trying to drive?
Maybe you want to convert more free trial users into paying customers. Or reduce churn. Or figure out why activation rates are dropping. Whatever it is, get laser-focused on the “why” behind your data strategy.
Once you’ve outlined those goals, set your KPIs and establish clear success metrics.
What does “improvement” look like?
How will you measure it?
What would make this initiative worth the effort?
This clarity upfront saves you from wasting time tracking metrics no one will ever look at.
2. Build a Tracking Plan (Yes, You Need One)
Every product analytics strategy starts with a tracking plan. Think of it as your blueprint.
At its core are events specific actions users take, like signing up, opening a feature, sending a message, or completing a purchase. Things like:
Which events to track
What properties to capture (e.g. device type, plan type, time to complete)
Where these events occur in the user journey
Here’s why this matters: if you miss a step in the flow, you lose valuable insight. A clean, comprehensive tracking plan ensures you get the full picture and not just fragments of it.
3. Don’t Let Implementation Get Rigid
Your product evolves. So should your analytics. Your tracking plan isn’t a one-and-done doc. It should evolve with:
New business goals
New product features
Insights from experiments
Shifts in team priorities
Review your tracking setup regularly to stay aligned. The best analytics platforms make this easier by giving you flexibility around event creation and tracking, so you’re not constantly waiting on engineers to push changes.
4. Make Product Analytics a Team Sport
Analytics works best when everyone has access and knows how to use it. That means:
Your technical team can monitor scalability
Your marketing team can shorten the path to conversion
Your exec team can forecast revenue and retention
Your product team can improve onboarding and feature adoption
Encourage cross-functional collaboration by making data accessible and contextual for each team.
Pro tip: get buy-in early by involving each team in setting metrics they care about.
5. Own Your Data Like a Product
Here’s a reality check: data is a product. And like any product, it needs a Product Owner.
That means:
Engineers shouldn’t be the ones designing the tracking strategy. That’s not their job—and it’s a terrible use of development time.
You need a data product manager or someone in a similar role to work with PMs and UX designers to define what success looks like for each new feature.
Someone should be responsible for:
Writing clear documentation for instrumentation
QA’ing events for data accuracy
Ensuring data governance
Turning raw data into insights stakeholders can use
Without this kind of ownership, your analytics will become messy, misaligned, and underused.
6. Stage-Specific Implementation Strategy
Early Stage (0–20 Employees)
Your primary focus: finding product-market fit.
Use analytics to understand if users are finding value
Track activation, engagement, and retention
Test your MVP, iterate fast, and validate with real usage data
Keep your setup simple—but meaningful
Mid Stage (20–100 Employees)
You’ve likely got product-market fit - now it’s time to scale.
Introduce experimentation and personalization into your workflows
Make analytics a part of your definition of done for every release
Hire an analytics lead or data product manager to formalize the function
Focus on improving retention, reducing churn, and increasing LTV
Begin treating analytics like a core product feature, not just a nice-to-have
Growth Stage (100+ Employees)
You’ve got a bigger team, a bigger stack, and a whole lot more complexity.
Set up processes for data quality and consistency - you’re likely pulling from multiple sources
Create a data catalog and documentation to keep your growing team aligned
Focus on data storytelling so teams can act on insights, not just admire dashboards
Beat the competition by using data not just for reporting, but for innovation
Don’t get disrupted by the startup with a leaner stack and sharper questions
7. Data Management: Keep It Clean, Accessible, and Trustworthy
It’s not enough to collect data - you have to manage it well.
Here’s what good data management looks like:
Accuracy: Know what data you're collecting and ensure it’s trustworthy
Structure: Store it in a way that prevents silos and promotes transparency
Accessibility: Make it easy for every team to find the insights they need, and when they need them
If your analytics data is disorganized, no one will use it. If it’s clean, usable, and visible? It becomes a growth engine.
If you treat analytics like an afterthought, you’ll get afterthought results. But if you bake it into your product, your process, and your culture, you get visibility, alignment, and confidence in every product decision.
Implementing product analytics the right way takes effort. But when you do it right, you don’t just get data, you get direction. And that’s how great products are built.
Conclusion
Product analytics is about narrative. It's the story of how your users experience your product—where they thrive, where they struggle, and where they disappear. It’s your flashlight in the dark.
In a world where product teams are expected to move fast, ship often, and grow sustainably, guesswork won’t cut it. You need answers. Clear, actionable, behavior-backed answers. That’s what product analytics delivers.
It’s how you shift from:
Hoping to knowing
Spreadsheets to strategy
Launches to learnings
Vanity metrics to value
The best teams treat product analytics as a non-negotiable part of product development. Not an afterthought. Not a side project. But a core function woven into every sprint, every decision, every bet.
Whether you're optimizing your onboarding, identifying friction in key flows, or scaling up with confidence, product analytics is how you build with intention—not intuition.
So here’s the bottom line:
If product management is about building the right thing, product analytics is how you prove it, improve it, and repeat it.
And in a competitive, customer-led, data-saturated world? That, friends, is your moat.
