


How to measure the impact of Product Tours on retention
A user’s first few moments in your app can make all the difference between them loving it or leaving it. That’s where Welcome Tours come in handy - to guide users to key features and help them find value fast.
You may very well be analyzing your Welcome Tours, but do you measure the impact on retention? If not, you should. While your Tour might be great for getting people to use the product for the first few days, measuring retention is essential to see whether it keeps users coming back over time.
As retention is now one of the most important metrics for growth in SaaS businesses, if you don't see that your onboarding process is having a positive impact, you know you need to make some adjustments.
In this recipe, we’ll show you how to use Chameleon to launch an engaging Welcome Tour, and then use Amplitude to analyze how it affects retention. Our native integration helps make this even more of a breeze!
Ingredients
A Chameleon account (any plan)
An Amplitude account (any plan)
Step 1: Set up Chameleon and Amplitude integration
Head to Integrations in your Chameleon Dashboard, click to connect Amplitude, and then click on “Enable” to finish the connection. The integration will then display as “Connected”.
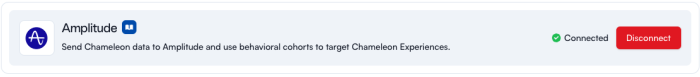
Then toggle on sending Chameleon Data Out to your Amplitude account.
Ensure that Amplitude is set up correctly within your client-side app so that data is prepared to be collected from Chameleon. For more information, head to Amplitude’s developer docs.
Once you’re set up, you'll now see Chameleon data show up on the Data page in your Amplitude account.
Step 2: Create a Segment of users in Chameleon
Now you’re going to create the segment of users to show your Welcome Tour to — users who have just logged into your app for the first time. Head to Segments and then use the filters:
Number of web sessions is exactly 1
First seen by Chameleon is within the last 1 day
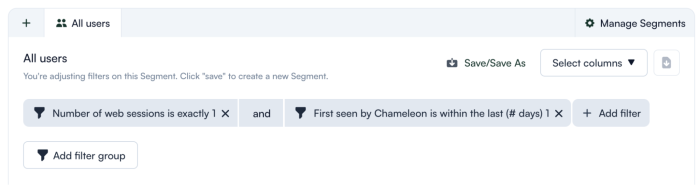
Click Save As, give it a name, e.g. “First-time users”, and click save.
Step 3: Launch your Welcome Tour
To drive higher completion rates, your Welcome Tour should only be 3–4 steps and only direct users to the most important features. That will get you the best completion rates and maximize engagement.
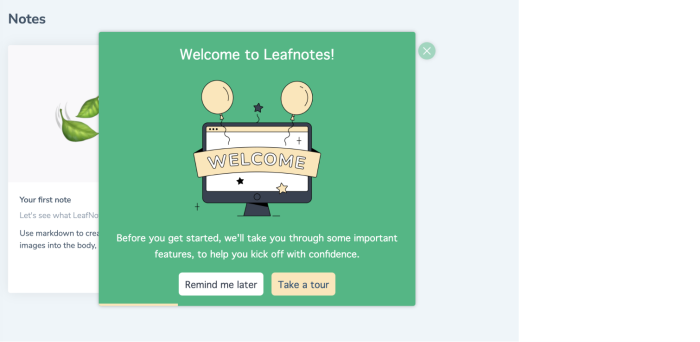
Start by creating an Announcement Tour in your Chameleon Dashboard. This is the first time you’ll communicate with your users in-app — so use copy that sets a great first impression and makes your users feel welcome and want to explore.
💡Not feeling creative today? Use our AI feature to generate or improve the copy for you!
Adjust the primary “Take a tour” button to link to the next step. Adjust the secondary “Remind me later” button to “Dismiss Tour”, and select “Snooze Tour” choosing how long until it displays again and how many times.
Add a second step to highlight a key feature that you want to give guidance on. Click on “Position”, select “Element”, “Adjust Element”, and select that feature. Add a pointer and a lightbox to highlight the feature to users.
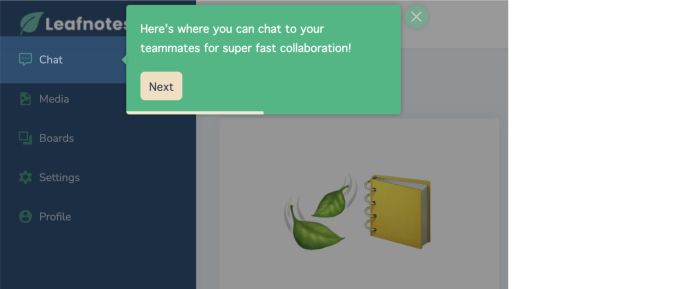
Repeat the process for your third step.
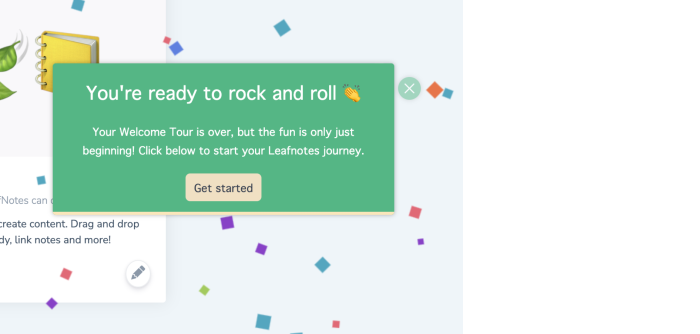
On your final step, add some confetti or hearts as a delight animation to celebrate success together with your users, and get them excited to start.
Once you’re happy with your design, go back to the Chameleon Dashboard to select your publishing criteria. Make sure you set the target audience as the segment of users we created earlier “First-time users”, define the goal as Tour completion (so you can analyze results afterward), and choose the recurrence to not repeat (this Welcome Tour is only relevant for first-time users).
Step 4: Analyze the impact on retention
Now you’re going to measure the impact that your Welcome Tour has on retention, by using Amplitude’s retention analysis tool to analyze how often these users are returning.
Head to your Amplitude dashboard, click “Create new” > “Analysis” > “Retention”.
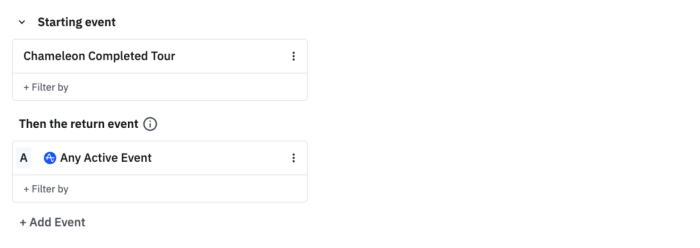
Select the starting event as “Chameleon Completed Tour”, and then the return event as “Any Active Event” to get a broad overview of retention. Or select a specific return event that marks importance in your product, for example “Form Submitted”, “Page Viewed”, or “Button Clicked” to see and compare the impact of your Welcome Tour on these events.
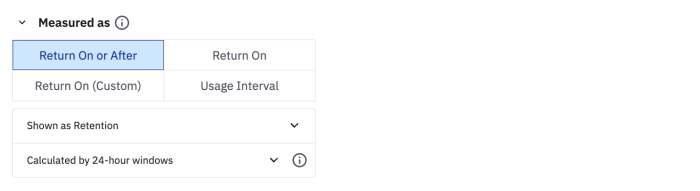
Select “Return on or after” to discover how many of your users returned on a specific day, or after they completed the Welcome Tour. You can also get more granular by choosing the exact day or usage interval for users performing the event.
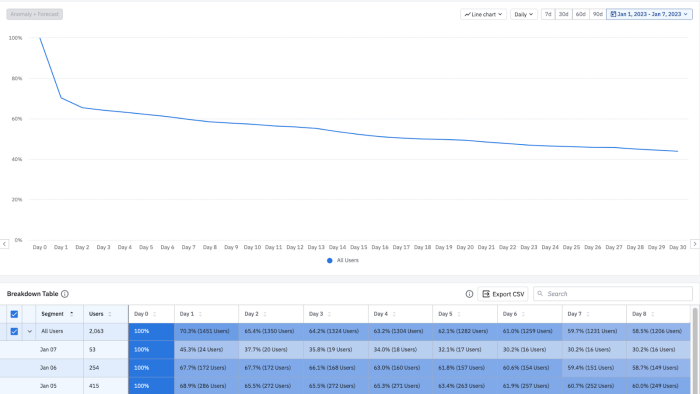
You’ll then be able to analyze the data using a line chart or bar chart, and a detailed table breaking down the data into user cohorts and individual days.
Check out Amplitude’s guide for more information about interpreting your retention analysis.
Congratulations
You deserve your own confetti delight animation. 🎉 Your Welcome Tour is now greeting users at the door, and you’re measuring its impact on retention along the user journey.
Learn more about Chameleon’s integration with Amplitude, and schedule some time with our team to discover how we can support you to provide exceptional onboarding throughout the customer journey.
