


Tour analytics
Automatic data collection and insightful reporting to help you succeed


Since 2023


Since 2024
Since 2024


Since 2025


Since 2025
4.4 stars from 348 reviews
Connecting the world's greatest companies to their customers


Chameleon Analytics Functionality
Optimize your onboarding and feature launches
Built for Optimization
Analyze funnels to see drop-off within Product Tours
Deeply Integrated
Send data to your analytics tools with our integrations
Birds-Eye View
See a full overview in one simple dashboard
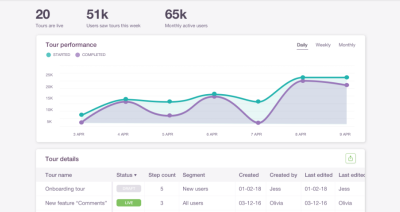
Reporting Dashboard
All performance metrics in one dashboard
Easily compare Product Tours, see issues and generate exports
Automatic event tracking
Capture user actions without writing code
Chameleon can start measuring pageviews and clicks without any coding, to help you target and analyze
A holistic view of user engagement
Chameleon data alongside your other product data

Amplitude
Better target Chameleon Experiences and deeply analyze them next to all your product data
.png)
Mixpanel
Target users based on behavioral data then analyze the impact

Heap
Pull in Heap data for targeting, push engagement metrics back
.png)
Google Analytics
Deeply analyze product and website data together

Twilio Segment
Use Twilio Segment to install Chameleon in your product, and seamlessly send data between all of your tools

Custom JS
Extend Chameleon with custom code to send data or trigger product actions
4.4 stars on G2
A data-driven platform for growth
Explore how Chameleon provides the data and reporting you need, by Getting Started today.