


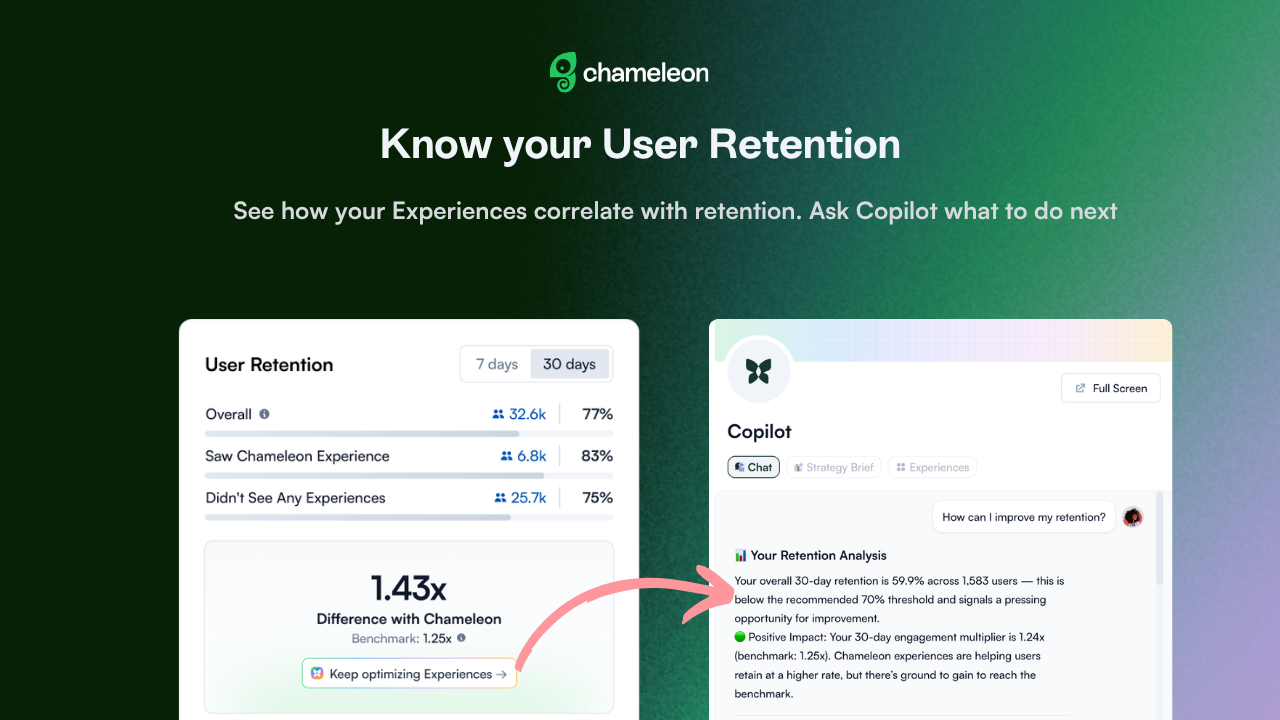
🎁 User Retention chart on your Homepage
Your Homepage now shows a direct comparison between users who engaged with your Experiences and users who didn't, with return rates for both. The 7-day and 30-day view, an Engagement Multiplier showing how much more likely engaged users are to return, and a benchmark give you the signal you can build from.
A 1.43x multiplier means users who engaged were 43% more likely to come back. That's the number you bring to your next team meeting, the one that tells "is any of this actually working?" And you're not just looking at a number in a vacuum; you can see how it stacks up against the Chameleon customer average.
When the number raises a question, Copilot has the answer. It generates a fresh analysis, reads your current position, checks it against the benchmark, and comes back with specific suggestions on what to build or adjust next. Check in monthly to make tweaks. Come back quarterly to see if the arc moved.
User Retention replaces User Coverage on your Homepage in the Chameleon Dashboard and is currently rolling out to all accounts.
