






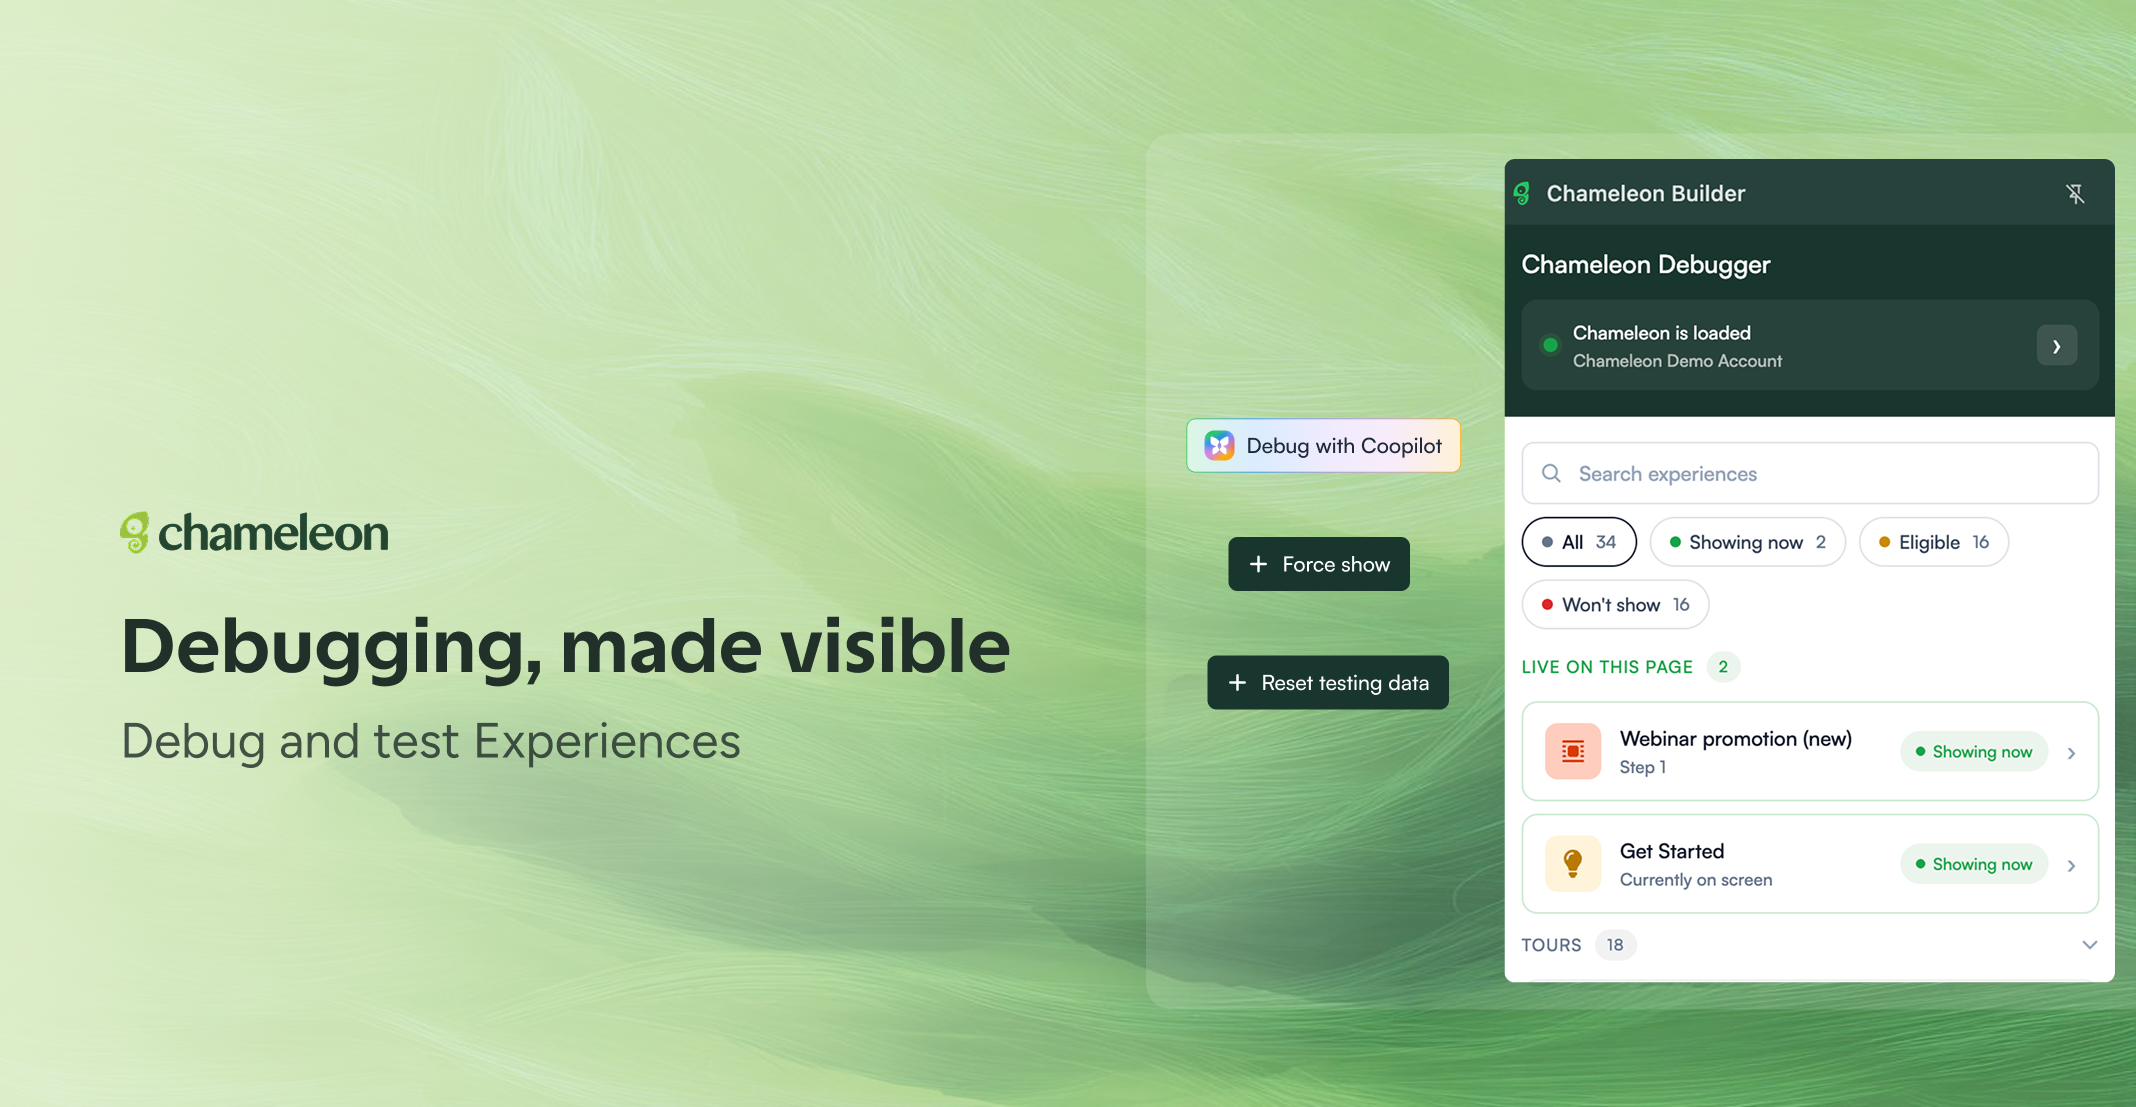
🎁 See why an Experience is or isn't showing
When an Experience isn't showing, the browser console is not where you'd want to spend your morning. The Debugger is now a slide-out panel and lets you skip DevTools. Open it from the Chrome Extension, and you see exactly what's happening: snippet load status, profile UID, and every Experience on the current page.
See: what's showing, what isn't, and what could, and which audience conditions a user does or doesn't meet. If you're still stuck after that, paste the output directly into Copilot, and it'll walk you through the fix.
You can force-show any Experience from the panel and reset user data without going back to the Dashboard. There's also a live activity feed showing events firing on the page.
The Improved Debugger is rolling out to all accounts on all plans.
📖 Learn more about the Debugger
✨ Also, text edits in the Builder now save the moment you stop typing, no need to click away or hit escape to know the change stuck. A stray click or a closed tab mid-edit won't cost you the last few minutes of work.