The Chameleon Benchmark Report 2023
A data-driven look at how companies are creating in-app UX patterns, and how users are responding to them. Compare how your Experiences perform and understand how trends are changing.
Use the arrows above to navigate
Use your keyboard to navigate
This year was one to remember. The effects of the macroeconomic climate rippled across the SaaS industry, slashing budgets and reducing headcount. It seemed all but certain that products left and right were about to face a reckoning.
But instead, we saw something remarkable. Instead of throwing more cash at acquiring new customers, SaaS orgs doubled down on optimizing their in-app guidance to drive conversion, retention, and upsells; driving efficiency and growth throughout the user journey.
For the fourth year running, the Chameleon team has dug deep into how users around the world create and interact with in-app UX patterns. We analyzed millions of interactions to bring you valuable insights on achieving product adoption success in 2023, and beyond.
This report takes data collected through Mixpanel from Chameleon experiences seen and engaged by end-users between January 1st, 2022 to December 31st, 2022. We examined over 212 million interactions with Chameleon to bring you insights on the latest trends and statistics to drive product adoption.
Welcome to our 2023 Benchmark Report.
An overview of the data from 2022
Last year was a busy one for product adoption. Here’s how many Chameleon Experiences were engaged by end users in the past 12 months, as well as some highlights from the report before we go deeper into what these stats mean for Product teams.
-
12M
Tooltips seen -
47M
Tours started -
1.8M
Launchers opened -
2.5M
Surveys started
The Year of Self-Serve
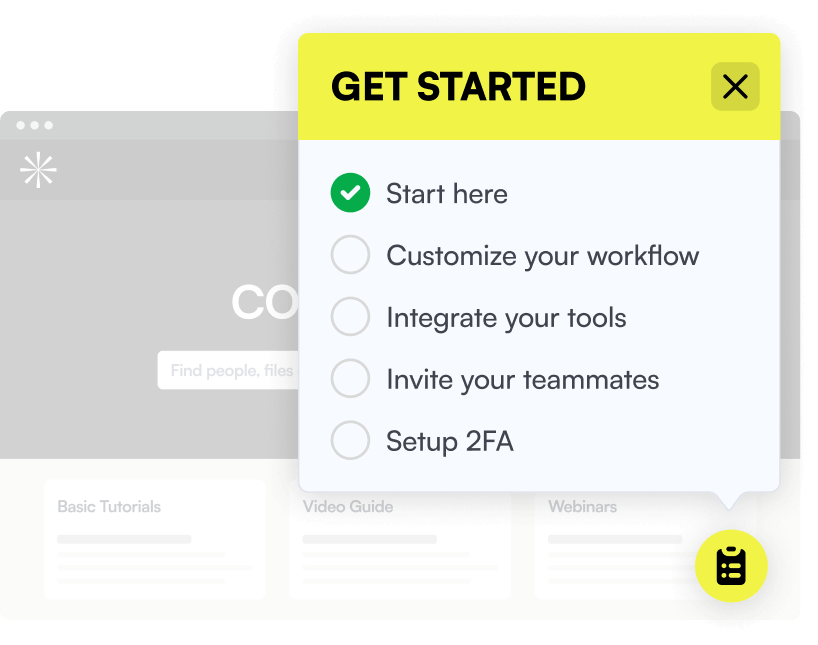
Something extraordinary emerged from our data. The usage numbers of our Checklist “Launchers” product in 2022, compared to 2021, boomed. There has been a huge rise in self-serve user onboarding; that is, allowing users to learn at their own pace.
This signals a big shift toward self-serve product adoption, where users are preferring to pace themselves during onboarding instead of being spoon-fed through “one-size-fits-all” style automated in-app messages. Not to say that personalized onboarding is on the decrease, though. More on that to come...
Monthly usage of Launchers
Product Tour completion rates are still strong
Alongside the rise of on-demand onboarding through Launchers, the average completion rates for in-app experiences continued to perform well, like the three previous reports we’ve done.
When we examined every product tour taken in 2022, no matter the length, one in three users who start a Tour will finish it. The average product completion rate was 30% for all tours – but not all tours are created equal, the top-performant Tours had more than double this completion rate.
Customer-obsessed companies are leveraging in-product Experiences
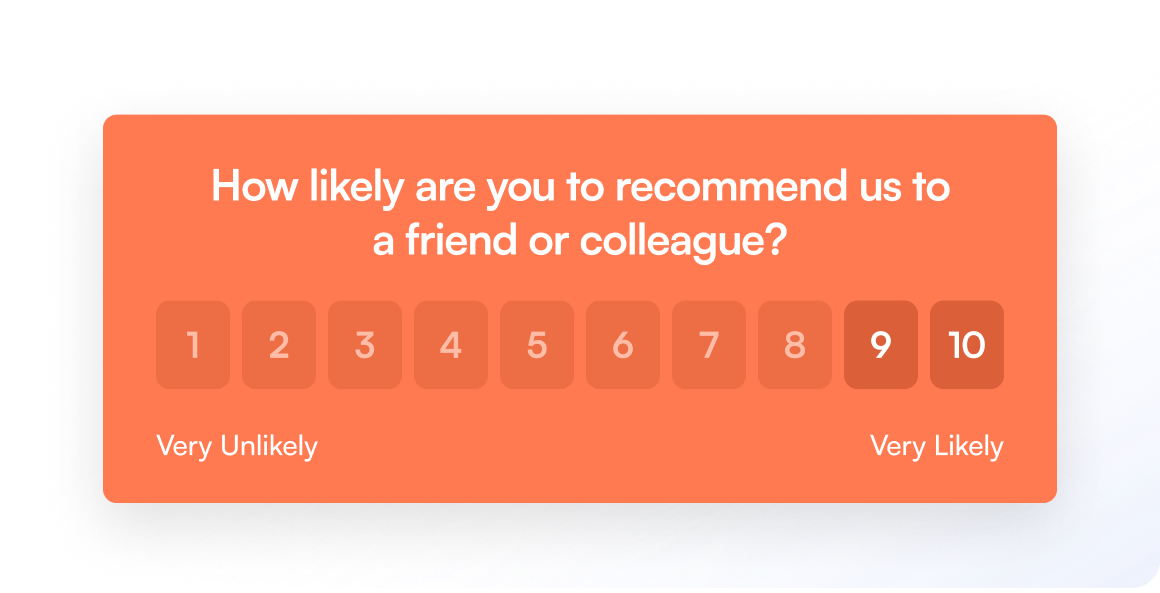
When we zoomed out on Microsurvey responses this year – we found some delighted end-users of our customers. In particular, when we examined NPS Surveys, we found that over 75% of our customers’ end-users are Promoters of their respective products.
It’s the Chameleon effect of customer-first companies leveraging in-product Experiences. Companies that leverage the in-app UX patterns we’ll discuss in this report, end up delighting their users by making it easy to find new features, get help when needed, and continuously iterate on their feedback.
The six themes we zoom in on in this report
Among all the insights we gathered, six key trends emerged from the data.
Product Tours with fewer steps continue to outperform long Tours in completion rates
Be contextual and use targeting to get the best results
Users love being onboarded at their own pace
Product adoption now goes beyond just product teams
Getting users to the 'aha' moment continues to be a priority
Users will have much more to say if you ask them at the right time
Short and sweet gets the job done
Product Tours with fewer steps continue to outperform long Tours in completion rates
Similar to previous years’ results, users continue to prove that they respond best to shorter tours, with completion rates dropping drastically when they go from four steps to five steps – or even over.
One change in the tides this year was that the Four-Step Tour took the top spot, as opposed to the Three-Step Tour, which had reigned supreme for the best product tour completion rates since 2019!
Completion Rate of Product Tours by Step Count
Time taken for completion of these tours also mirrors this. The average duration for completed tours was 132 seconds. This means your entire tour should take around two minutes to complete.
Other things you can also do in 2 minutes
-
 Make an espresso
 -
 Make popcorn
 -
 Play “I Get Around” by The Beach Boys
According to Miller's Law, the average person can keep up to around seven items in their working memory. This means that the fewer items your users have to retain, the more successful they will be in learning new information. This is why you should build your Tours in as few steps as possible.
Show don't tell
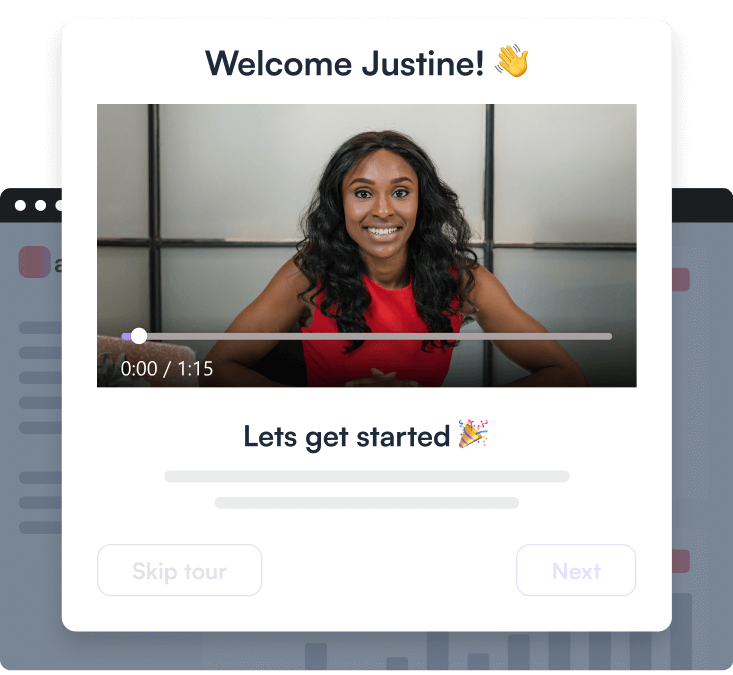
Looking at all Tours with video; they had a higher completion rate overall at 47.67%, proving once again that video outperforms text-only onboarding on user engagement.
We were intrigued by this one, so went deeper into the stats. Looking at the reigning champion, the Four-Step Tour, and filtering by Tours that contained video, we found that they had a 64.49% completion rate - a 4% extra lift from using videos.
Users just want to have fun
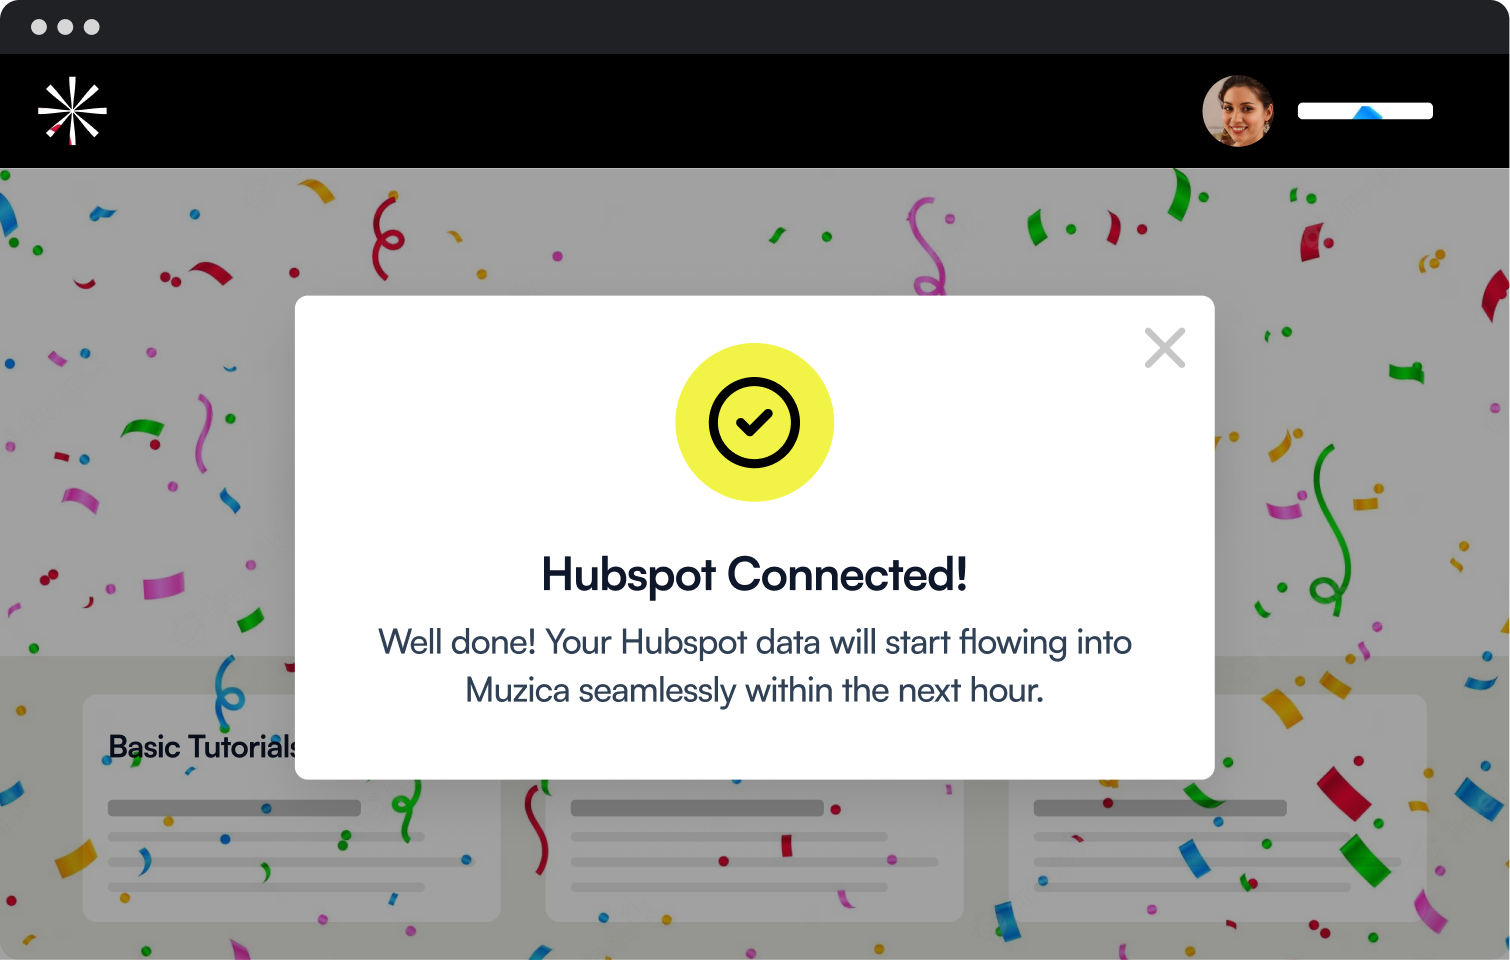
A bit of fun goes a long way. Tours with delight animations (confetti or hearts falling behind the modal) had a 45.03% completion rate, well above the average. Show your fun side and reward users for completing core actions in your product tours – they’ll stick around for longer.
Timing has never been so important
Be mindful of the context and use targeting to get the best results
Context is king. User guidance is most effective when it starts under the right context, such as the experience triggering only when the Tour is relevant to what is on the page.
To demonstrate, Tours that are positioned relative to on-page triggers have a completion rate of 69.56%, which is more than double the overall average rate and gives you a lift of 16% on the top-performant Four-Step Tour.
Serve only when wanted
Though in-app experiences are meant to help users, if they’re not triggered at the right times, they can be perceived as unwanted, and end up being an irritant instead.
When we looked into data on Tooltips, we found that a whopping 98% of them are triggered when a user hovers over an on-page element, e.g. when their curiosity is piqued, and they’re interested in finding out more about the highlighted feature. This pattern of delivery is contextually relevant and shows the user information that is appropriate for the occasion, a nudge towards further actions.
Here’s another interesting example of how adjusting your experiences to user behavior is key to better completion rates. Tour completion rates for Tours that trigger via a click were much higher than hover. A user can hover over an element with no intention of ever checking out the feature, but a click shows higher intent, which explains the higher completion rate.
Save it for later
Timing also means giving users a variety of options for when they can learn more about what you’re trying to share. Your Experiences should accommodate every user’s situation, that includes letting users come back when they want to.
Don’t be afraid to let users snooze your Tour – the classic phrase “you snooze, you lose” really doesn’t apply here. When given the option, one in five users who snooze a Tour will come back to complete it. So much better than an outright dismissal, and more like “if you don’t offer a snooze, you lose”.
Postel’s Law states that a design that tolerates as much as possible from the user and anticipates any user input will be much more resilient. Which is why snoozing works. By giving people the option to snooze an Experience, we open up that possibility.
Self-serve onboarding is booming
Users love being onboarded at their own pace
Last year, Product-Led Growth (PLG) was, and continues to be, the talk of the SaaS world. An evolution of the PLG movement is “Self-Serve”; whether that’s in your Support, Sales process, or onboarding in this report’s case.
When we examined the data, we zoomed in on how Launchers performed for self-serve onboarding and guidance. Launchers are small but mighty in-app checklist widgets where you can list key onboarding tasks and helpful resources.
As we mentioned in this report’s introduction, we saw a huge upward trend in Launcher usage in 2022. Compared to the previous year’s report, Launcher engagement e.g. a user clicking an item on a Launcher is up 1100%.
How many Launchers were Opened by Year
Onboard-as-you-go
Firstly, more Tours are now being started from Launchers than before, with 54.5% of users who engage with a Launcher, going on to start a Tour from said widget. Last year, that figure stood at 34%. If you’re seeing low numbers with your automated Tours, try offering users the option to start, or retake a Tour from a Launcher and give users the gift of choice.
Users are setting their own pace
Double tapping on those Tours started from Launchers. We found that those Tours had a 61.65% completion rate, which is almost double the overall average tour completion rate, proving that self-serve is truly the way to go.
The Zeigarnik Effect is the tendency for people to remember unfinished or interrupted tasks more than completed ones. This explains why self-serve has such a high completion rate. Giving users the ability to come back to incomplete tasks whenever they want to, helps them be motivated to finish them.
Product adoption is a team sport
It takes a village to create successful users
Product adoption is widely owned by product teams, and that continues to be the case. When looking at the roles of users on Chameleon accounts, we naturally found users with Product roles to be leading the charge on leveraging Chameleon to drive product adoption.
But our data from 2022 has shown that the thirst for product adoption has spread to other teams.
This shows that organizations are increasingly noticing the value that product adoption has in creating efficiencies.
- 👨🏻💻 Engineering
- 📱 Product
- 📈 Marketing
- 👨🏻💻 Customer Service
- 👨🏻💻 Sales
- 💾 Information Technology
- 👩🏼💼 Leadership
- 📋 Operations
- 🙋🏽♂️ Human Resources
- 💰 Finance
Grease for the sales funnel
In particular, participation by sales teams has doubled compared to 2021. Product adoption has many sales use cases, including convincing trial users to convert, as well as facilitating upsells. It is no wonder that sales teams have started to integrate product adoption into their processes.
Automating customer success
We also saw usage by customer service teams grow 50% from last year. This, coinciding with the general trend of self-serve increasing, points to how customer success managers are relying on various self-serve support tools to automate their work, such as creating help menus and onboarding checklists.
Taking charge of product adoption
Now that the age of ‘growth at all costs’ has come to an end with tighter budgets and increased scrutiny on spending, C-Suite executives will be on driving efficiencies and pushing conversion. This means that the leadership, all the way up to the CEO, will be far more involved in buying tools to boost product adoption than ever before.
Our data proves this, there has been a 19% increase in usage by Leaders within the organization. It’s a sign that executives, who are often those most obsessed with results in a company, have truly started to internalize the value of product adoption to their bottom line.
-
Customer service43% growth
-
Sales61% growth
-
Leadership19% growth
-
Marketing19% growth

User onboarding is the most sought-after use case for customers
Getting users to the “aha!” moment continues to be a priority
User onboarding is a powerful tool for feature adoption, and that is reflected clearly by the numbers we saw in the beginning. Tours are still the most actively used and seen experiences among all of Chameleon’s offerings.
Onboarding is Chameleon's bread and butter
Here, we looked at the titles of Tours created by Chameleon's customers. After running these through a word cloud and distilling the top five, we found these to be the most popular titles:
- Onboarding
- Welcome
- Announcement
- Release Notes
- Sales
This shows us that onboarding is still the number one use case that teams have on their mind when they use Chameleon, with the words “Onboarding” and “Welcome” occupying the top spots.
“Announcement” and “Release Notes” also won top spots in this list, showcasing the continuous onboarding that happens in-product; not just for the first-time user experience, but for new features and releases too.
Coming in close in position #5 was “Sales”. This reflects what we saw in the previous theme that more Sales members were joining the product adoption efforts.
User motivation is high for onboarding
It’s not just our customers who think that onboarding is the most important use case for in-app experiences. In fact, our end-users view onboarding as just as important, if not more.
Tour names that contained the word “onboard” had the highest completion rate, at 48.03%.
Another observation here is that Tour names containing the word “feature” had the second-highest completion rate, which points to how users are generally hungry to learn about what they can do with the product, throughout the continuous onboarding journey. Here’s what Carlos Gonzalez de Villaumbrosia, Founder & CEO of Product School had to say on these data points.
Investing in delivering an excellent experience through the product has two main benefits:
1. It increases customer retention and upsells opportunities.
2. It allows leveraging existing customers to bring new ones.
Customer onboarding plays a key role in allowing new customers to get to product value as fast as possible and increase the frequency of the loop between points 1 and 2."

In-app is still the best way to ask for feedback
Users will have much more to say if you ask them at the right time
In 2022, over 442k people completed surveys. That’s a lot of feedback. What’s even more interesting here is that around one in six users who start a Microsurvey will complete it.
In this year’s findings, the best-performing type of in-app survey was the two-button format with one in three users responding to this survey style, indicating that simplicity may be the way to go. However, last year’s Microsurvey completion rate winner, the five-button option, still follows in a close second place with 29.6% of users giving their feedback.
Completion Rate of Microsurveys by Survey Type
CSAT dethrones NPS
NPS has long been the ruler of customer satisfaction surveys for SaaS products, but the tides look to be turning.
This year, CSAT surveys had twice the completion rate of NPS surveys, while last year, CSAT surveys lagged behind NPS surveys.
One reason we can think of is that CSAT surveys are more intuitive than NPS. CSAT surveys often come with visual aids of smiley faces, while NPS prompts the user to pick between 1 and 10, which may be more confusing than simply saying that a click on a mood emoji
CSAT is triggered more based on user action e.g. after completing an activation milestone, than NPS which is more often set on a timed-cadence

Hick’s Law states that the more options available to a person and the more complex the choices, the longer the decision will take. This may explain why a CSAT survey, which tends to have fewer choices than an NPS survey and is more intuitive, is excelling.
Ask and you shall receive
While you may think that users won’t have time in their day to write more detailed feedback, it turns out that people have much to say when they fill out a survey.
59% of those who completed a survey left comments. Those comments can be valuable feedback that gives you a good look into users' minds. So keep those comment fields open!
Plus, if you’d like to ask even more from your users, you can leverage integrations to easily invite users for more in-depth feedback. For instance, with Chameleon, you can launch a Typeform survey with a button click, or have users book a meeting through Chili Piper or Calendly all within your app.

The Chameleon Effect on User Happiness
As with last year’s results, more than half of Chameleon’s end-users rated our customers’ products 10/10 with two out of three being promoters. That’s the power of in-app experiences.
NPS scores given to Chameleon Customers
The best of the rest
We've seen plenty of intriguing insights from the last year. Here are some other fun data points we found along the way.
We’re going around the world
In 2022, we went live with Localization features – and our customers are joining us! We saw Tours created in ten different languages: Kamæleon, Chamäleon, camaleón, カメレオン, caméléon, kameleon, con cắc kè, camaleão, 变色龙, and of course, Chameleon.

A change in seasons
It turns out that the best time to launch Tours is the first quarter of the year, with an average of 42.50% completion. Maybe people have a new lease of life after the festivities and are eager to learn!

Testing makes perfect
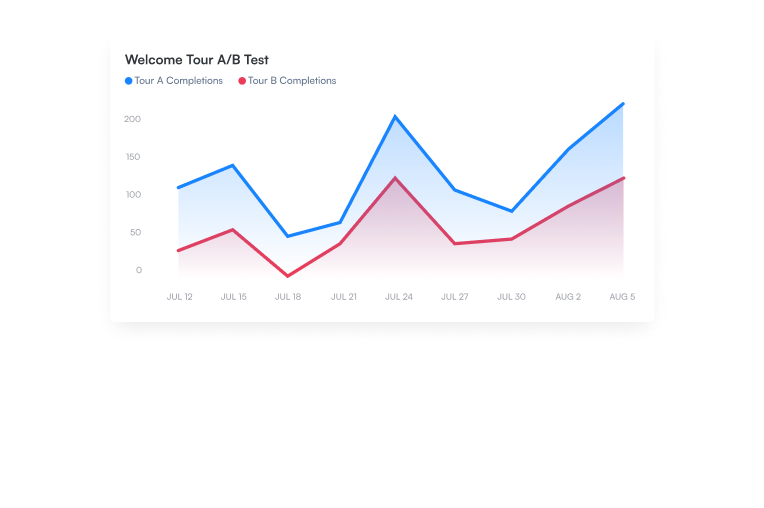
Tours started from A/B test experiments had completion rates of 41.18%, which is higher than the average, meaning that our customers are successfully leveraging experimentation to perfect their in-app flows.
Wrapping up a year to remember
By now, it's clear that 2022 was also a year full of learning. Not just for our customers and their users, but also for the Chameleon Team! Some highlights from the last year for us were:
- The Beta release of our fifth product line, HelpBar. This is a “spotlight search” bar that brings your existing help content to your users when they need it most - when they're already inside your product (and for free!)
- New integrations with the most popular SaaS tools out there; HubSpot, Hightouch, Zapier, Heap, Zendesk, and Chili Piper, to name a few, and the list keeps growing.
- Massive improvements to our Launchers product. This mighty widget now has Welcome and Empty States, notifications for users, progress bars, and room for media
- Moving the Experience configuration in the Dashboard for a smoother and more sophisticated building flow, with advanced control over styling, permissions, domains, and much more. Of course, everything got a revamp, from Builder to our Chrome Extension.
- Enabling complete control over where Experiences display with Environments. Plus more features to round up the Dashboard: Additional Actions, Alerts, Scheduling (and rescheduling), bulk-Tagging and deleting users, and the Debugger tool for quick troubleshooting.
- Our Series A Announcement and the product redesign we went through ...Not to mention the countless feature updates, performance boosts, and bug fixes we've done. We’ve been hyper-focused on building the deepest product adoption platform.
Summing it up before we go
That is what this report is all about, to help people leverage our experiences more effectively so that they can achieve growth during these uncertain times.
Let's reflect on some of the key insights:
- Shorter is always better: Four-Step Tours have the best completion rates
- Always tailor your in-app Experiences to be contextual
- Tours started from self-serve Launchers are far more effective
- More people outside of product teams are getting involved in product adoption
- User onboarding is the most important in-app experience to customers and users alike
- Two-button and CSAT survey types had the highest response rates
Most of all, 2022 was a year that self-serve went big, with more users engaging with Launchers than ever, and completion rates for Tours started from Launchers going through the roof. It is a signal that self-serve onboarding is finding its mark with users.
So, where do you go from here? The first thing is to take all the lessons from 2022 and apply it to your own in-app UX. Create experiments that battle-test these insights and perfect your onboarding flows.
If you’ve never created some of the experiences mentioned in the report, such as Launchers or Microsurveys, now’s the perfect opportunity. Take advantage of the report’s findings and leverage them to grow your product.
Lastly, if you have never tried Chameleon, we invite you to give it a go. We have a free trial and a sandbox environment. So you can play around to your heart’s content. Or book a call with a Product Expert and find out how we can help you drive product adoption in 2023. Hey, we might even see you featured here next year 😉
Create engaging and native-looking in-app UX patterns with Chameleon, the deepest product adoption platform.
Try building Tours, Launchers, Microsurveys, and Tooltips in the Chameleon Playground - without setting anything live on your site. Or book a demo with a Product Expert to discuss how Chameleon can help you win in 2023 and beyond.
